98 Maps
New urban-rural typology of Nordic countries
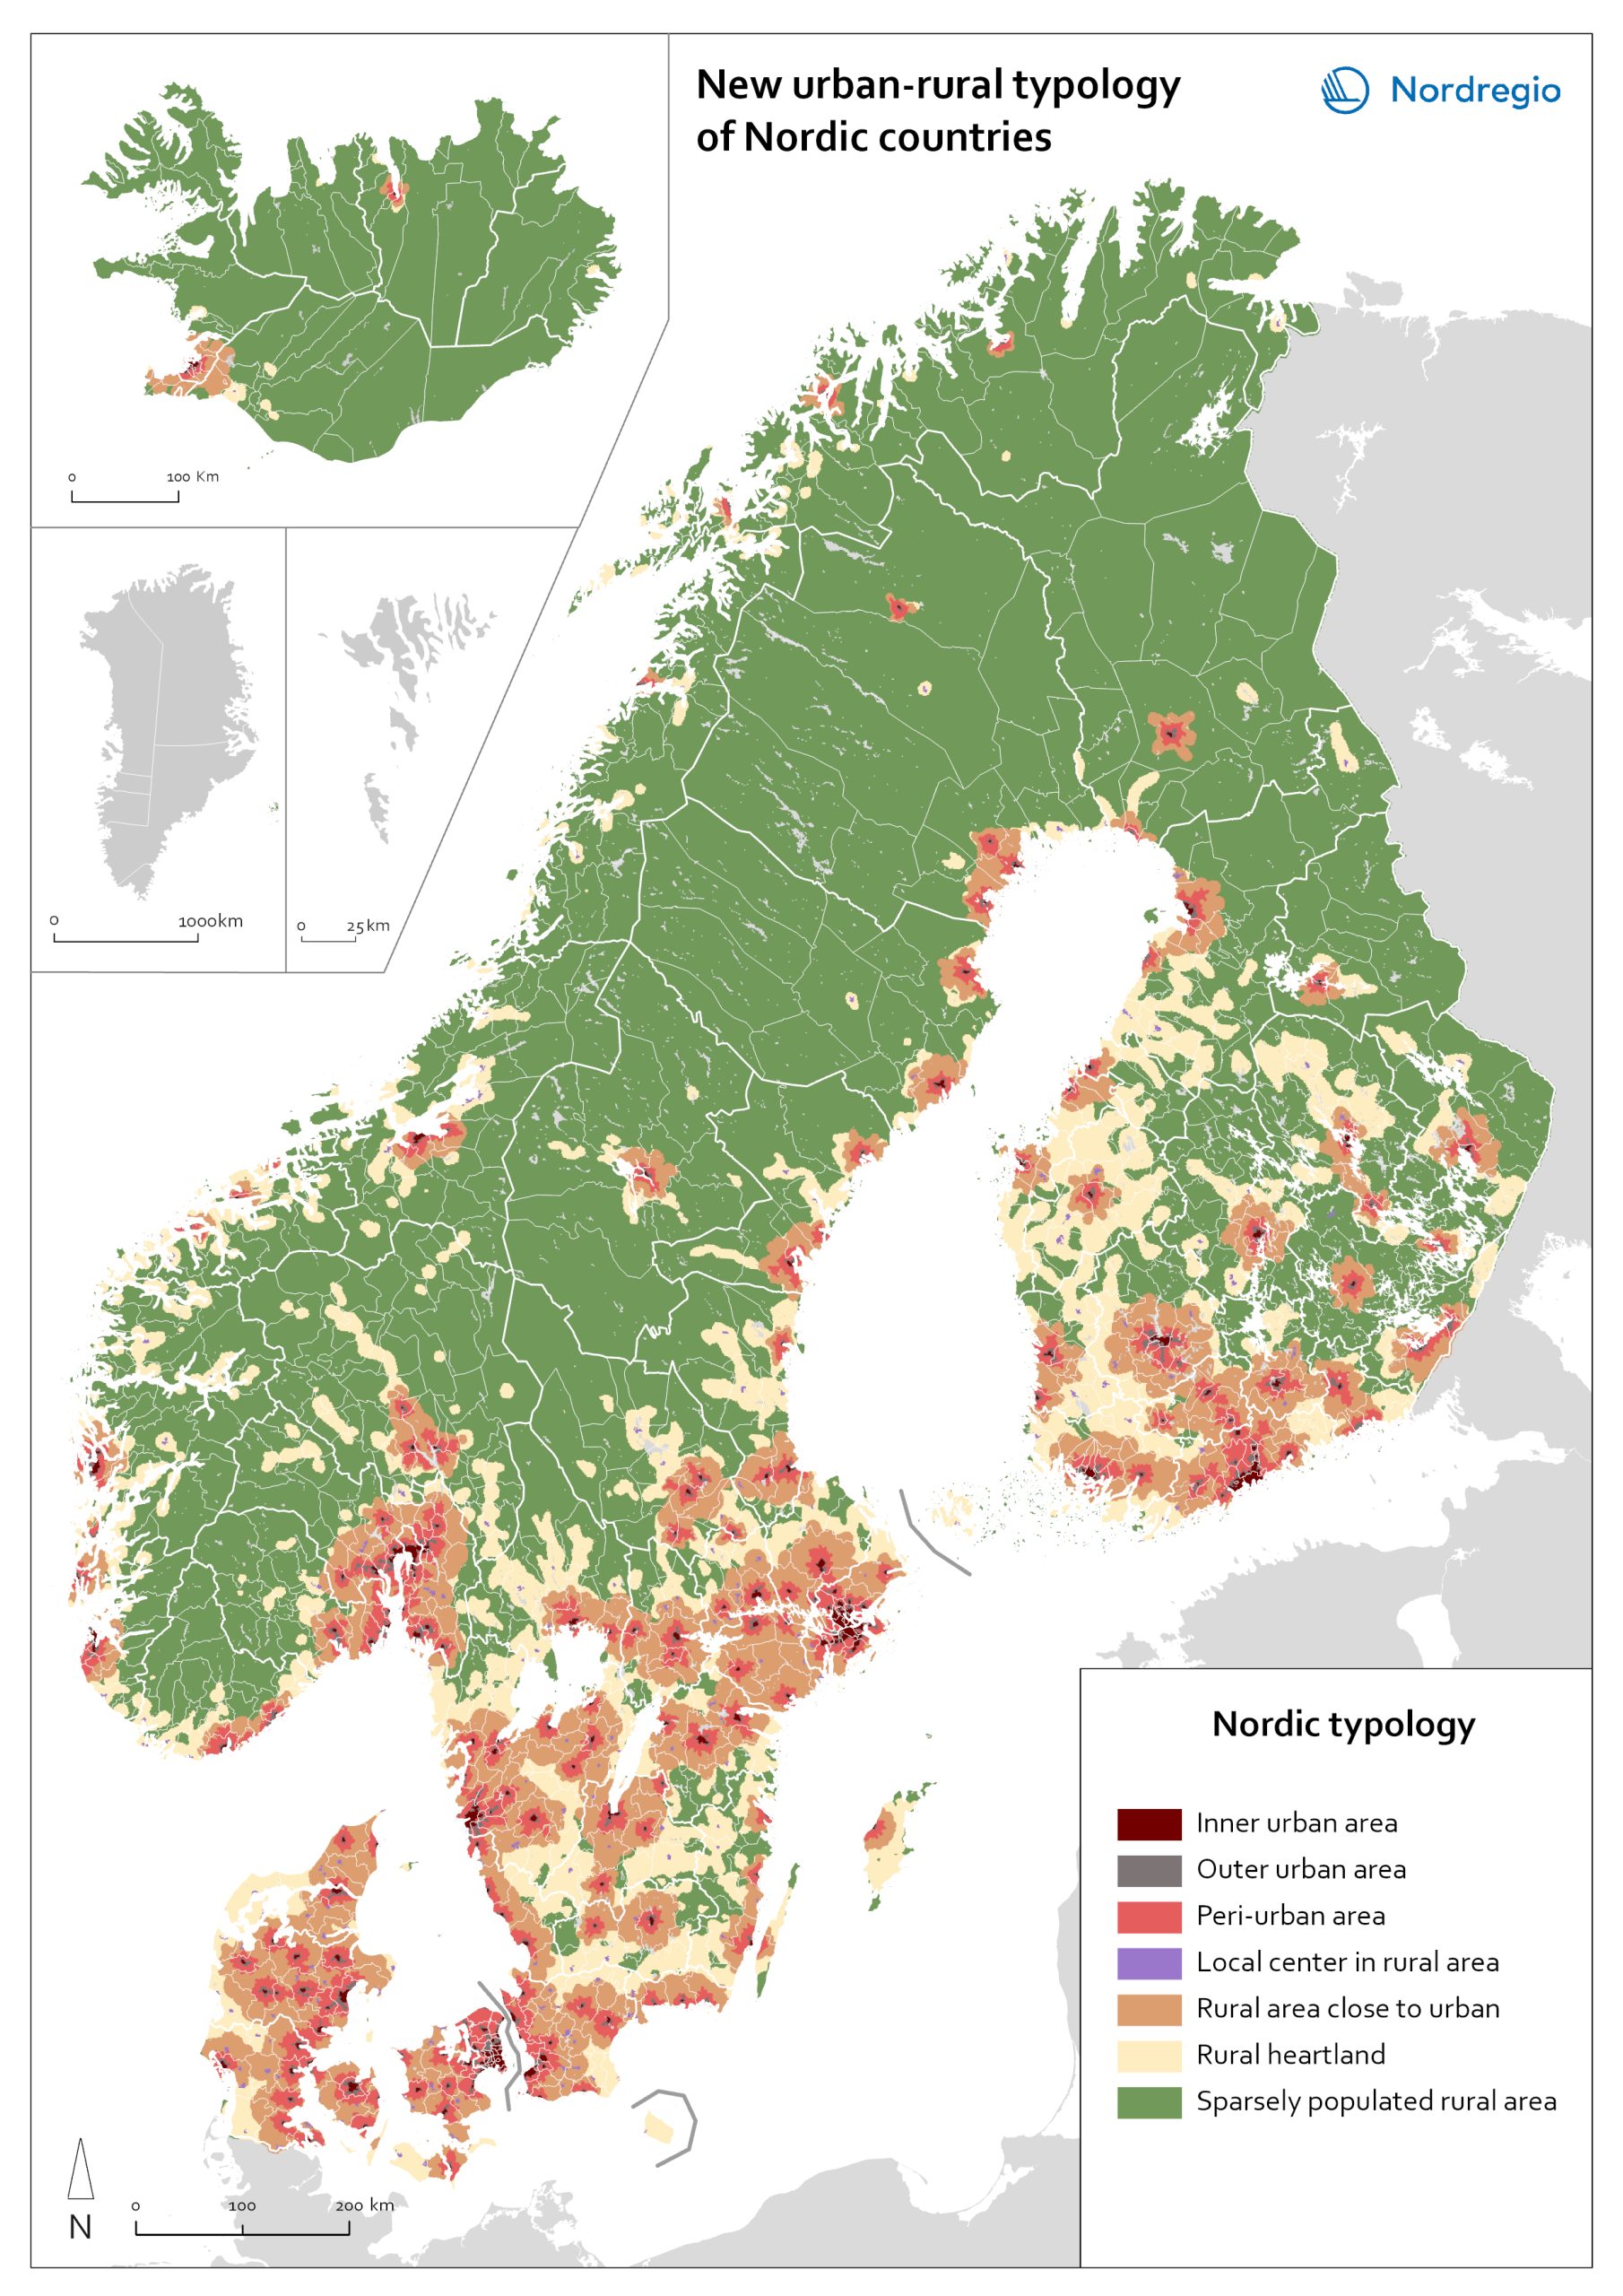
A map portrays a new urban-rural typology based on the grid-level data. New Nordic urban-rural typology is a grid-based classification of areas developed by the Nordic Thematic groups 2021-2024 to enable more accurate cross-Nordic statistical comparisons. The seven classes are defined based on population density, proximity measures and land cover parameters. Read more about the typology here . Inner urban area is the most densely populated part of the urban core. Urban cores are clustered cells summing up to at least 15 000 inhabitants, and these are divided into Inner and Outer urban areas based on density criterion (population density and building floor space). Outer urban area is the least densely populated part of the urban core. Urban core areas are clustered cells with at least 15 000 inhabitants, and these are divided into Inner and Outer urban areas based on density criterions (population density and building floorspace). Peri-urban area is the intermediate zone between urban core and the rural. It is based on generalized travel-time estimates from the edges of outer urban areas (6 min travel-time zones) and smaller urban settlement (4,5 min travel-time zones). Local centers in rural areas are population centers located outside urban areas, small towns and large parish villages where population is between 5000-14999 inhabitants. Rural areas close to urban areas have a rural character that are functionally connected and close to urban areas. In average this means 20-30 of minutes’ drive time from the edge of outer urban area. This class overwrites the area classes ‘Rural heartland’ and ‘Sparsely populated rural areas’. Rural heartland. Rural areas with intensive land use, with a relatively dense population and a diverse economic structure at the local level. Most of the agricultural land is in this class. Sparsely populated rural areas. Sparsely populated areas with dispersed small settlements that are located at a distance from each other.…
2023 January
- Administrative and functional divisions
- Nordic Region


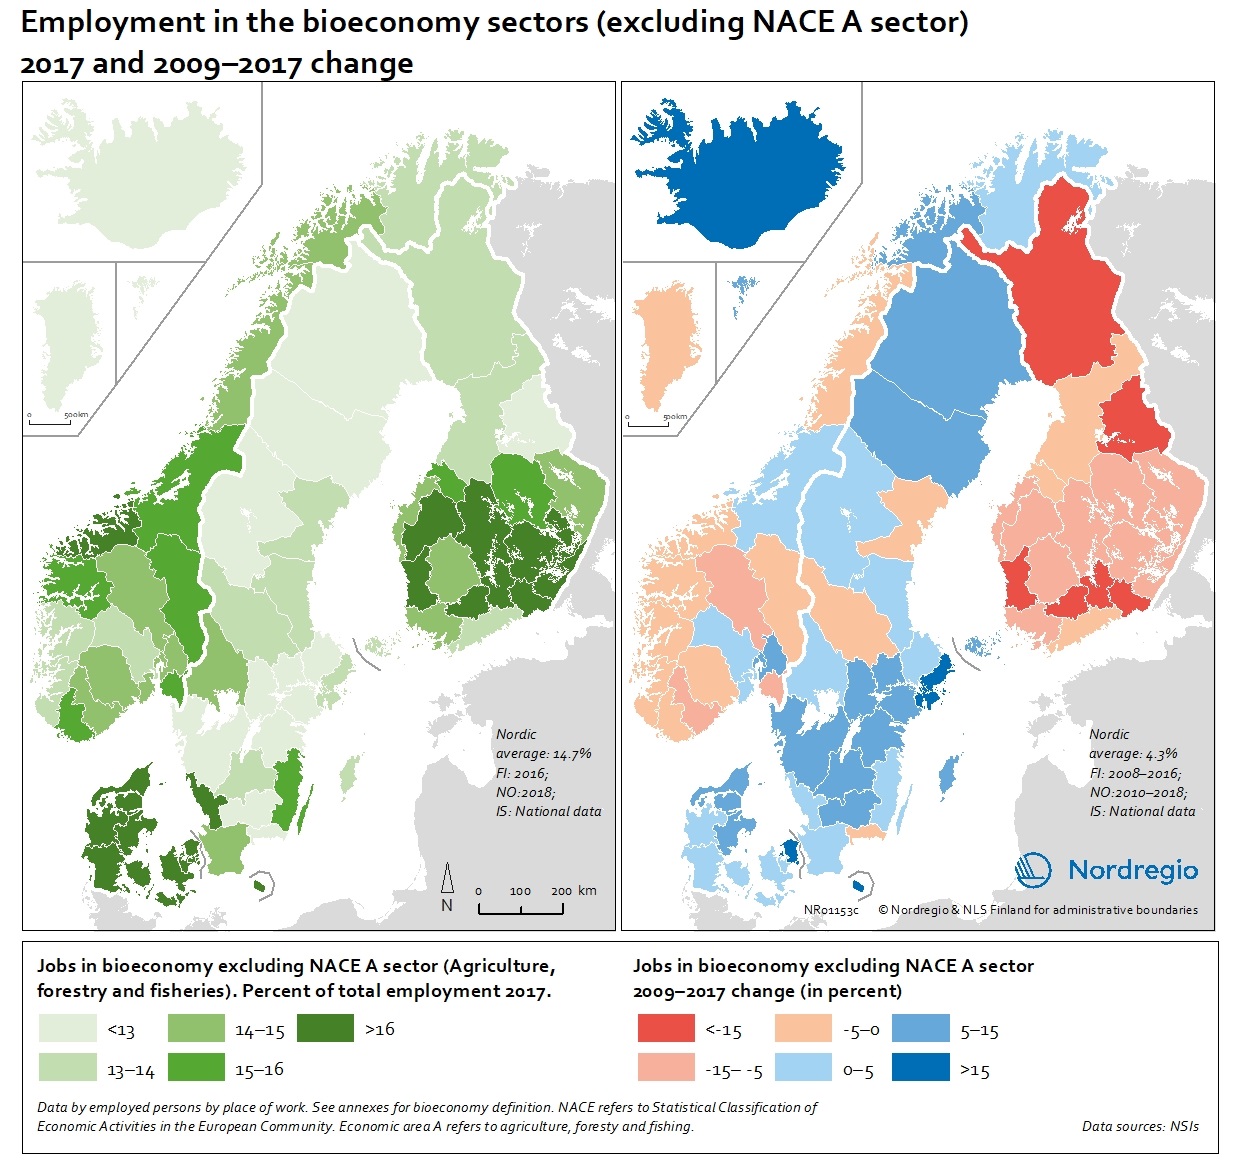
People employed in the bioeconomy excluding NACE sector A in 2017 and 2009-2017 change
These maps show the number of jobs in the bioeconomy sectors as a share of the total employment in 2017 (left) and 2009-2017 change (right), excluding the NACE A sectors. The non-NACE-A sectors have seen a more moderate decrease in Finland but a noticeable increase in most parts of Sweden, Denmark and the Faroe Islands and a remarkable increase in Iceland with more than 15% (Figure 9.3). The average increase in the Nordic Region is 4.3% in the non-NACE-A sectors. There are also notable differences within the countries, showing that regional differences matter. In Denmark, Greenland and the Faroe Islands, there is a positive trend in most regions, but in Finland, almost all regions are losing jobs in the primary industries. In Norway and Sweden, some regions show positive development while others are in decline. Read the digital publication here.
2020 February
- Economy
- Labour force
- Nordic Region
People employed in the agriculture, forestry and fisheries sectors (NACE Sector A) in 2017 and 2009-2017 change
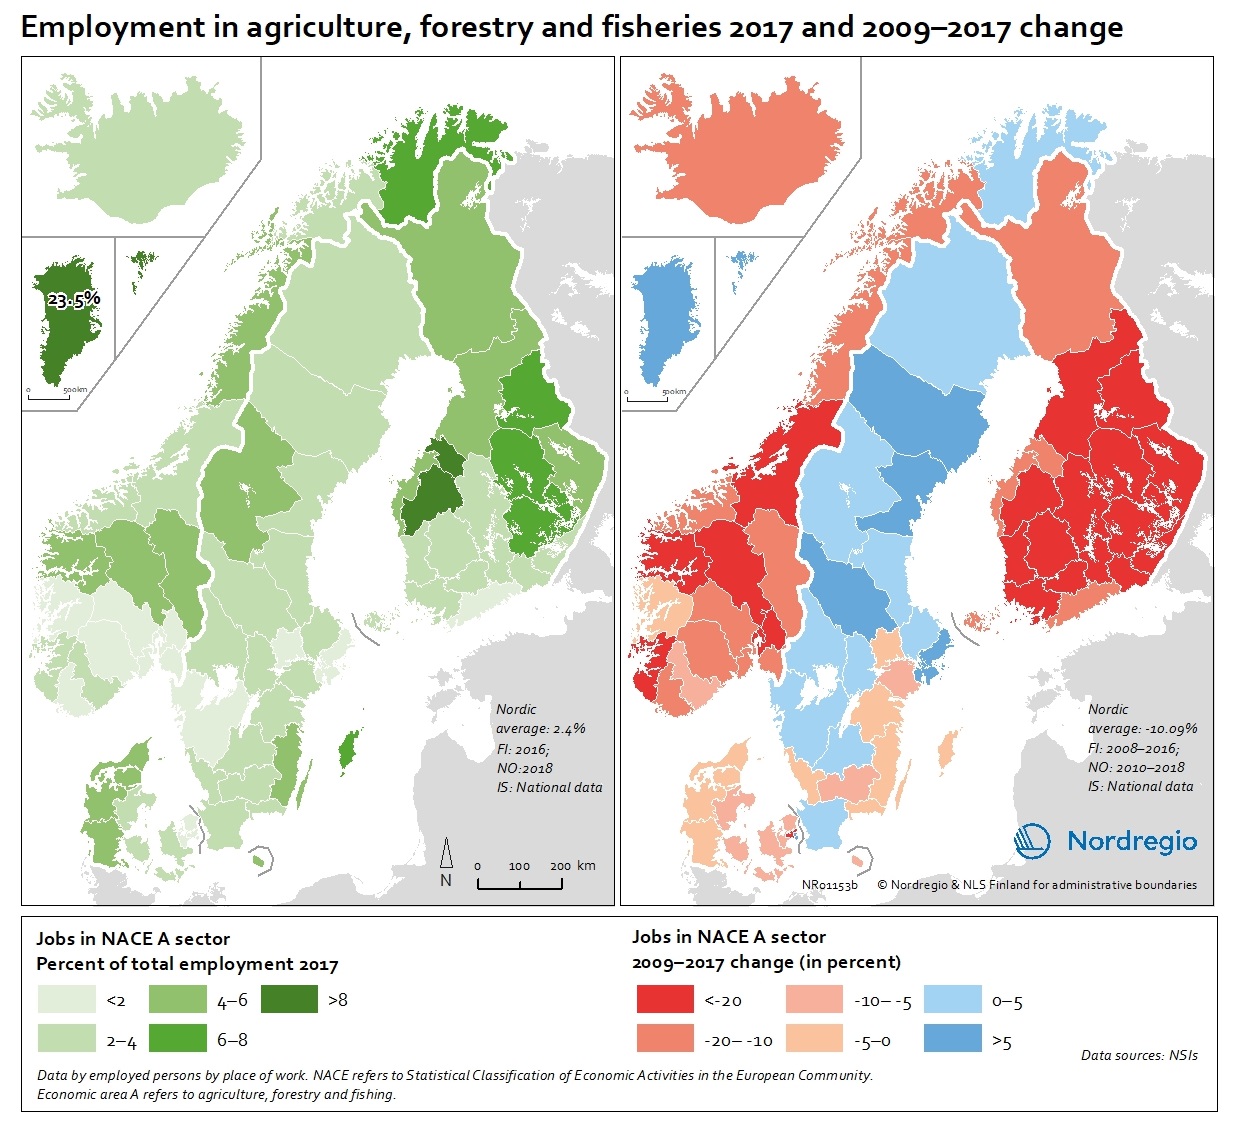
These map show the number of jobs in the agriculture, forestry and fisheries sectors (NACE A sectors) as a share of the total employment in 2017 (left) and 2009-2017 change (right). The map (left) indicates ranges of people employed in agriculture, forestry and fisheries sectors between below 2% to above 8%, with the highest proportion being in Greenland with 23.5% in 2017. In the EU-28, the overall proportion of the total workforce with jobs in the NACE-A sectors is an average of 4.6%. Overall, the NACE-A sectors show a sharp decline in employment (right map), particularly in Finland, Iceland and Norway (except northern Norway), where the decline was up to 20% between 2009 and 2017. Read the digital publication here.
2020 February
- Economy
- Labour force
- Nordic Region

People employed in the bioeconomy including NACE sector A in 2017 and 2009-2017 change
These maps show the number of jobs in the bioeconomy sectors as a share of the total employment in 2017 (left) and 2009-2017 change (right). The share of jobs in the bioeconomy varies from below 15% to above 22.5%. For instance, in the western regions of Denmark, the central and southern regions in Finland, Greenland and some mid and northern regions of Norway, over 22.5% of the working population is employed in the bioeconomy. At the same time, most regions in mid-Norway, in all Finnish and some Danish regions witnessed negative development in jobs in the bioeconomy. In Greenland, Iceland, Faroe Islands, Sweden, Northern Norway and other parts of Denmark the situation is very different and the number of jobs in the bioeconomy has increased. These proportions should also be seen in relation to the increase in total number of jobs17 in most regions in the Nordic countries except for the Finnish regions and Åland where there is a decline in most regions. Read the digital publication here.
2020 February
- Economy
- Labour force
- Nordic Region

Urban-rural typology of the Nordic regions 2020
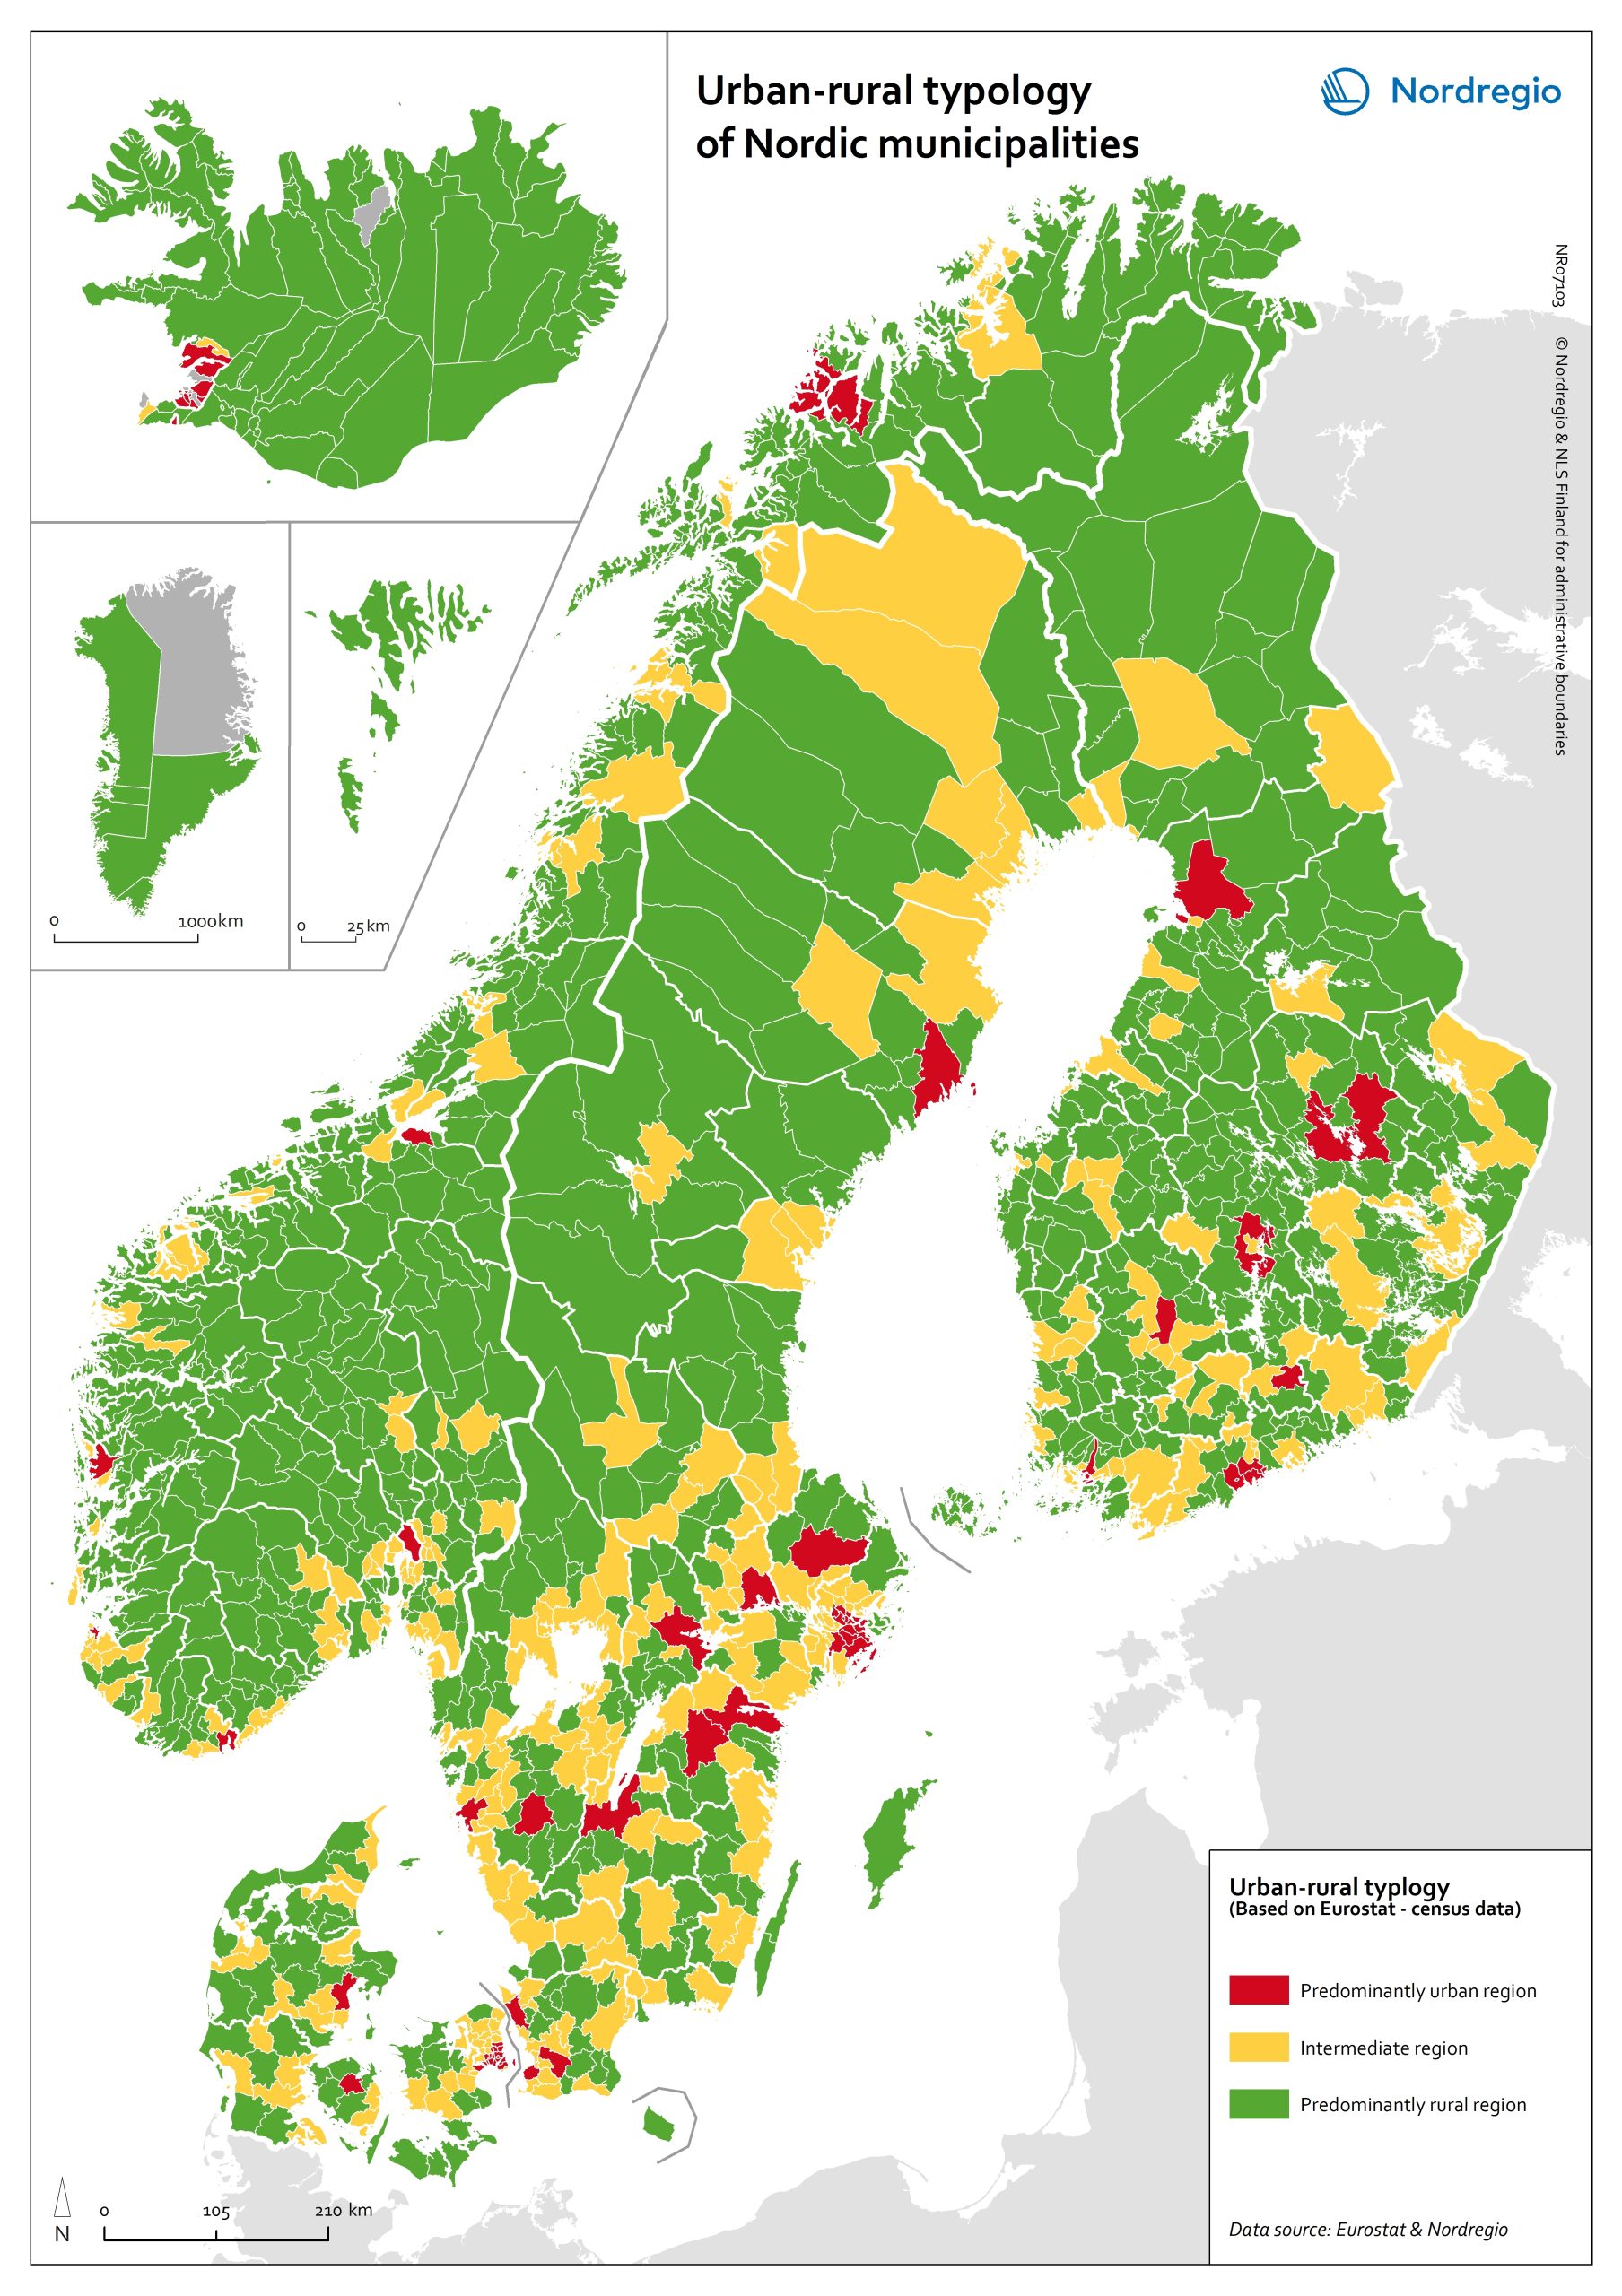
This map is included in the introduction of the State of the Nordic Region 2020 report. The map is based on the typology provided by Eurostat (2018), in which the 2016 NUTS 3 regions are classified in three categories according to their population density in 2011 and 2015, in 1 km² grids. In predominantly urban regions, at least 80% of the total population is urban, while in intermediate regions, 50–80% of the population lives in urban clusters. In regions that are predominantly rural, less than 50% of the population lives in urban areas. Read the digital publication here.
2020 February
- Administrative and functional divisions
- Nordic Region



Population change in Arctic settlements
The map provides an overview of the population change in Arctic settlements with 500 inhabitants or more during the period 2000 to 2017. The purple underlaying layer shows the extent of permafrost across the Arctic. The circles indicate settlements with 500 inhabitants or more and are proportional to the total population in 2017. Blue tones indicate population growth between 2000 and 2017, while red tones indicate population decline. Four zoomed-in maps show areas with high settlement density – Arctic Fennoscandia, Iceland, the Faroe Islands, and Alaska. In Alaska, population increased in the largest settlements between 2000 and 2017. The population decline in small settlements located far from the two large cities – Anchorage and Fairbanks – has been caused by outmigration, which has cancelled out the positive natural population growth. In the Canadian Arctic, most people live in a few settlements. Similar to Alaska, the population increased in the largest settlements and decreased in small settlements. Most of the smaller settlements in Arctic Fennoscandia have witnessed a population decline between 2000 and 2017, except in Norway. The dominant pattern in Fennoscandia is a population growth in larger settlements and a population decline in surrounding smaller settlements. This is similar to the pattern observed in the other Nordic Arctic countries – Iceland, Greenland, and the Faroe Islands. New inhabitants settled in the capitals (Reykjavik, Nuuk, and Torshavn) and regional centres, from both domestic and international locations, while settlements in sparsely populated areas are becoming less attractive to incomers. In the Russian Arctic, the regions can be divided into the oil and gas areas of the Khanty-Mansi and Yamal-Nenets, and other areas. The population is growing in the oil and gas areas and declining slowly in the others. Over 75% of the settlements have been shrinking throughout the 21st century, mainly because…
2019 March
- Arctic
- Demography
- Migration

Indigenous population in the Arctic
The map shows the indigenous population as a share of the total population in the Arctic. Approximately one million people, or 9% of the total population in the Arctic is indigenous. Indigenous population reassembles more than 40 different ethnic groups. In terms of statistics there are no circumpolar definition of an indigenous person and therefore the number of indigenous people is based on different national definitions. Official statistics do not necessarily recognize indigenous populations separately. The indigenous population is the highest in the Canadian Arctic and in Greenland, weighing more than 75% of the total population. The Yukon, the southern part of Northern Quebec, and Labrador and Newfoundland (Canada) have the lowest shares of indigenous population. In the remaining part of the Arctic, indigenous peoples represent less than half of the total population, except in Sakha (Russian Federation), Southwest Region and Northern Region (Alaska, USA) where 50-75% of the population is indigenous. There are no indigenous people in Iceland, the Faroe Islands and Svalbard.
2019 March
- Arctic
- Demography

