154 Maps
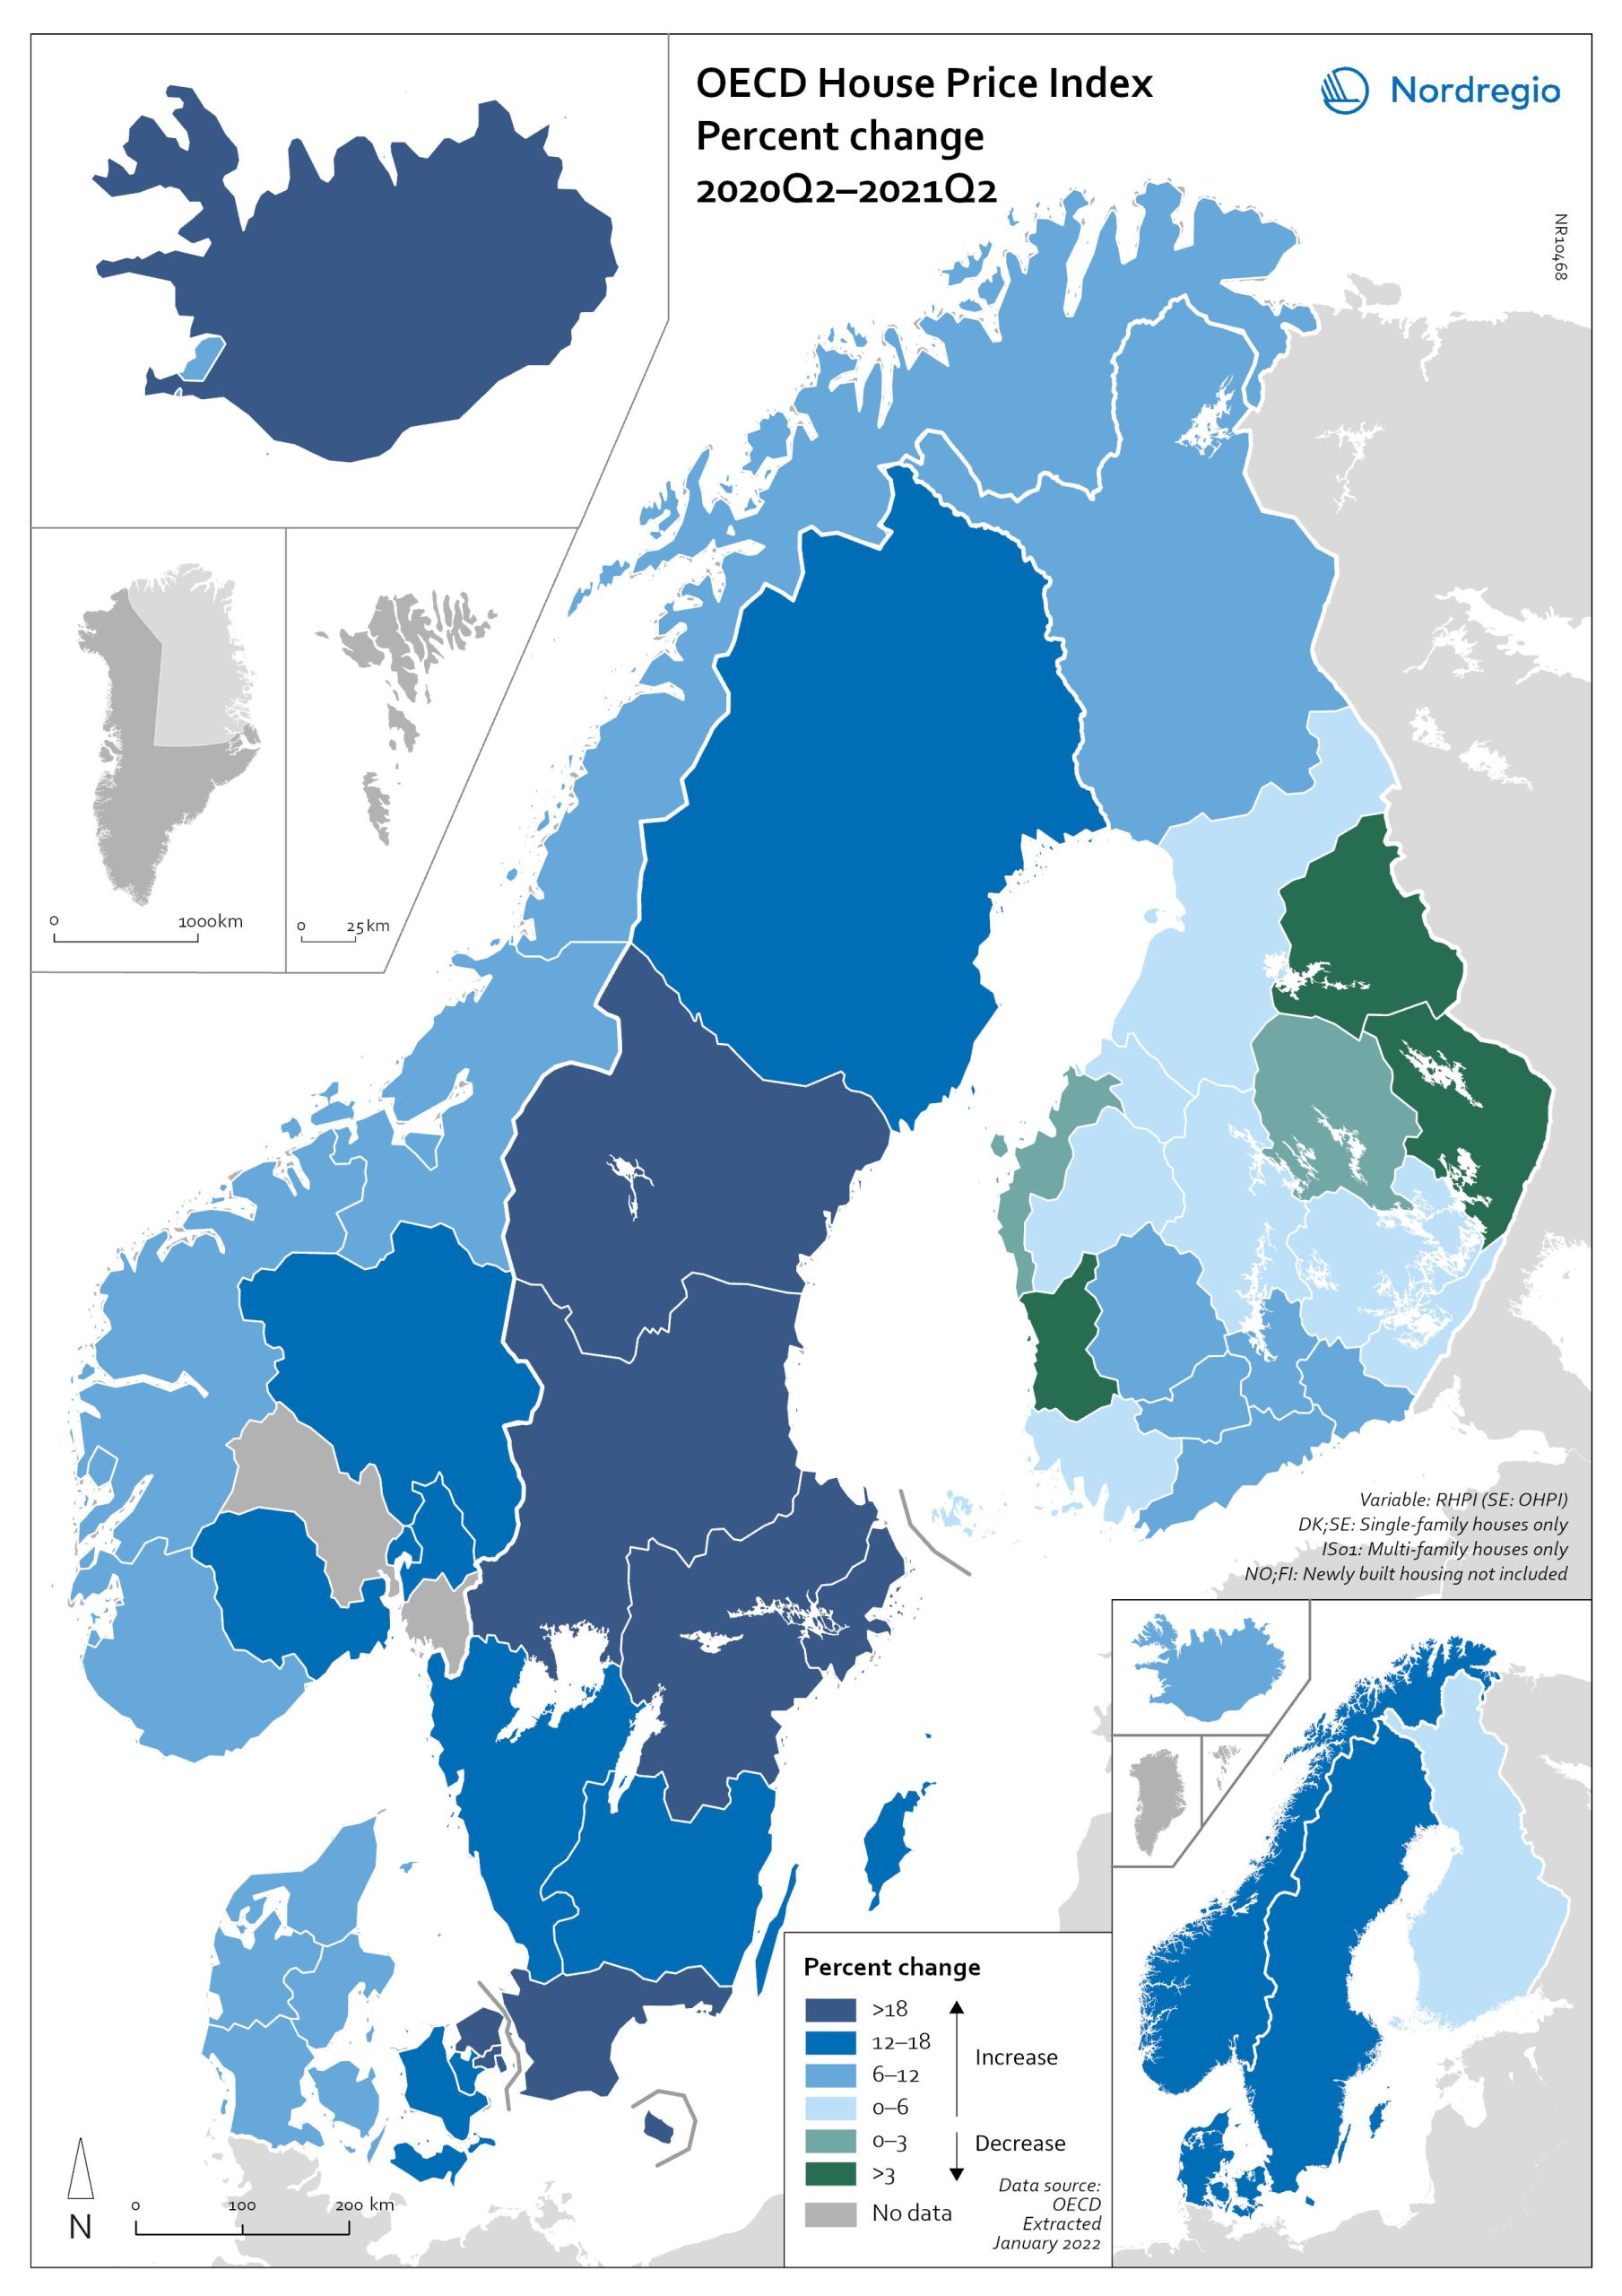
OECD House Price Index. Change 2020Q2–2021Q2
The map shows the relative change of the OECD House Price Index from Q2 2020 to Q2 2021. The map shows that the price development was not uniform within the countries. Iceland recorded the largest price increases overall, with the most marked price increases found outside of the capital region. All Swedish regions recorded increases above 20%, with the highest increases in the Stockholm and Malmö regions. All Norwegian regions showed price increases, though to a lesser extent than Swedish regions in most cases. In Denmark, Bornholm, Sjælland and the rural islands of Lolland and Falster recorded relatively high price increases, although many rural areas developed from low absolute prices in 2020. Finland was the only country where some regions saw property prices decrease. Moderate increases were still observed in some of the southern regions, where the major cities are located, and in the north.
2022 March
- Economy
- Nordic Region
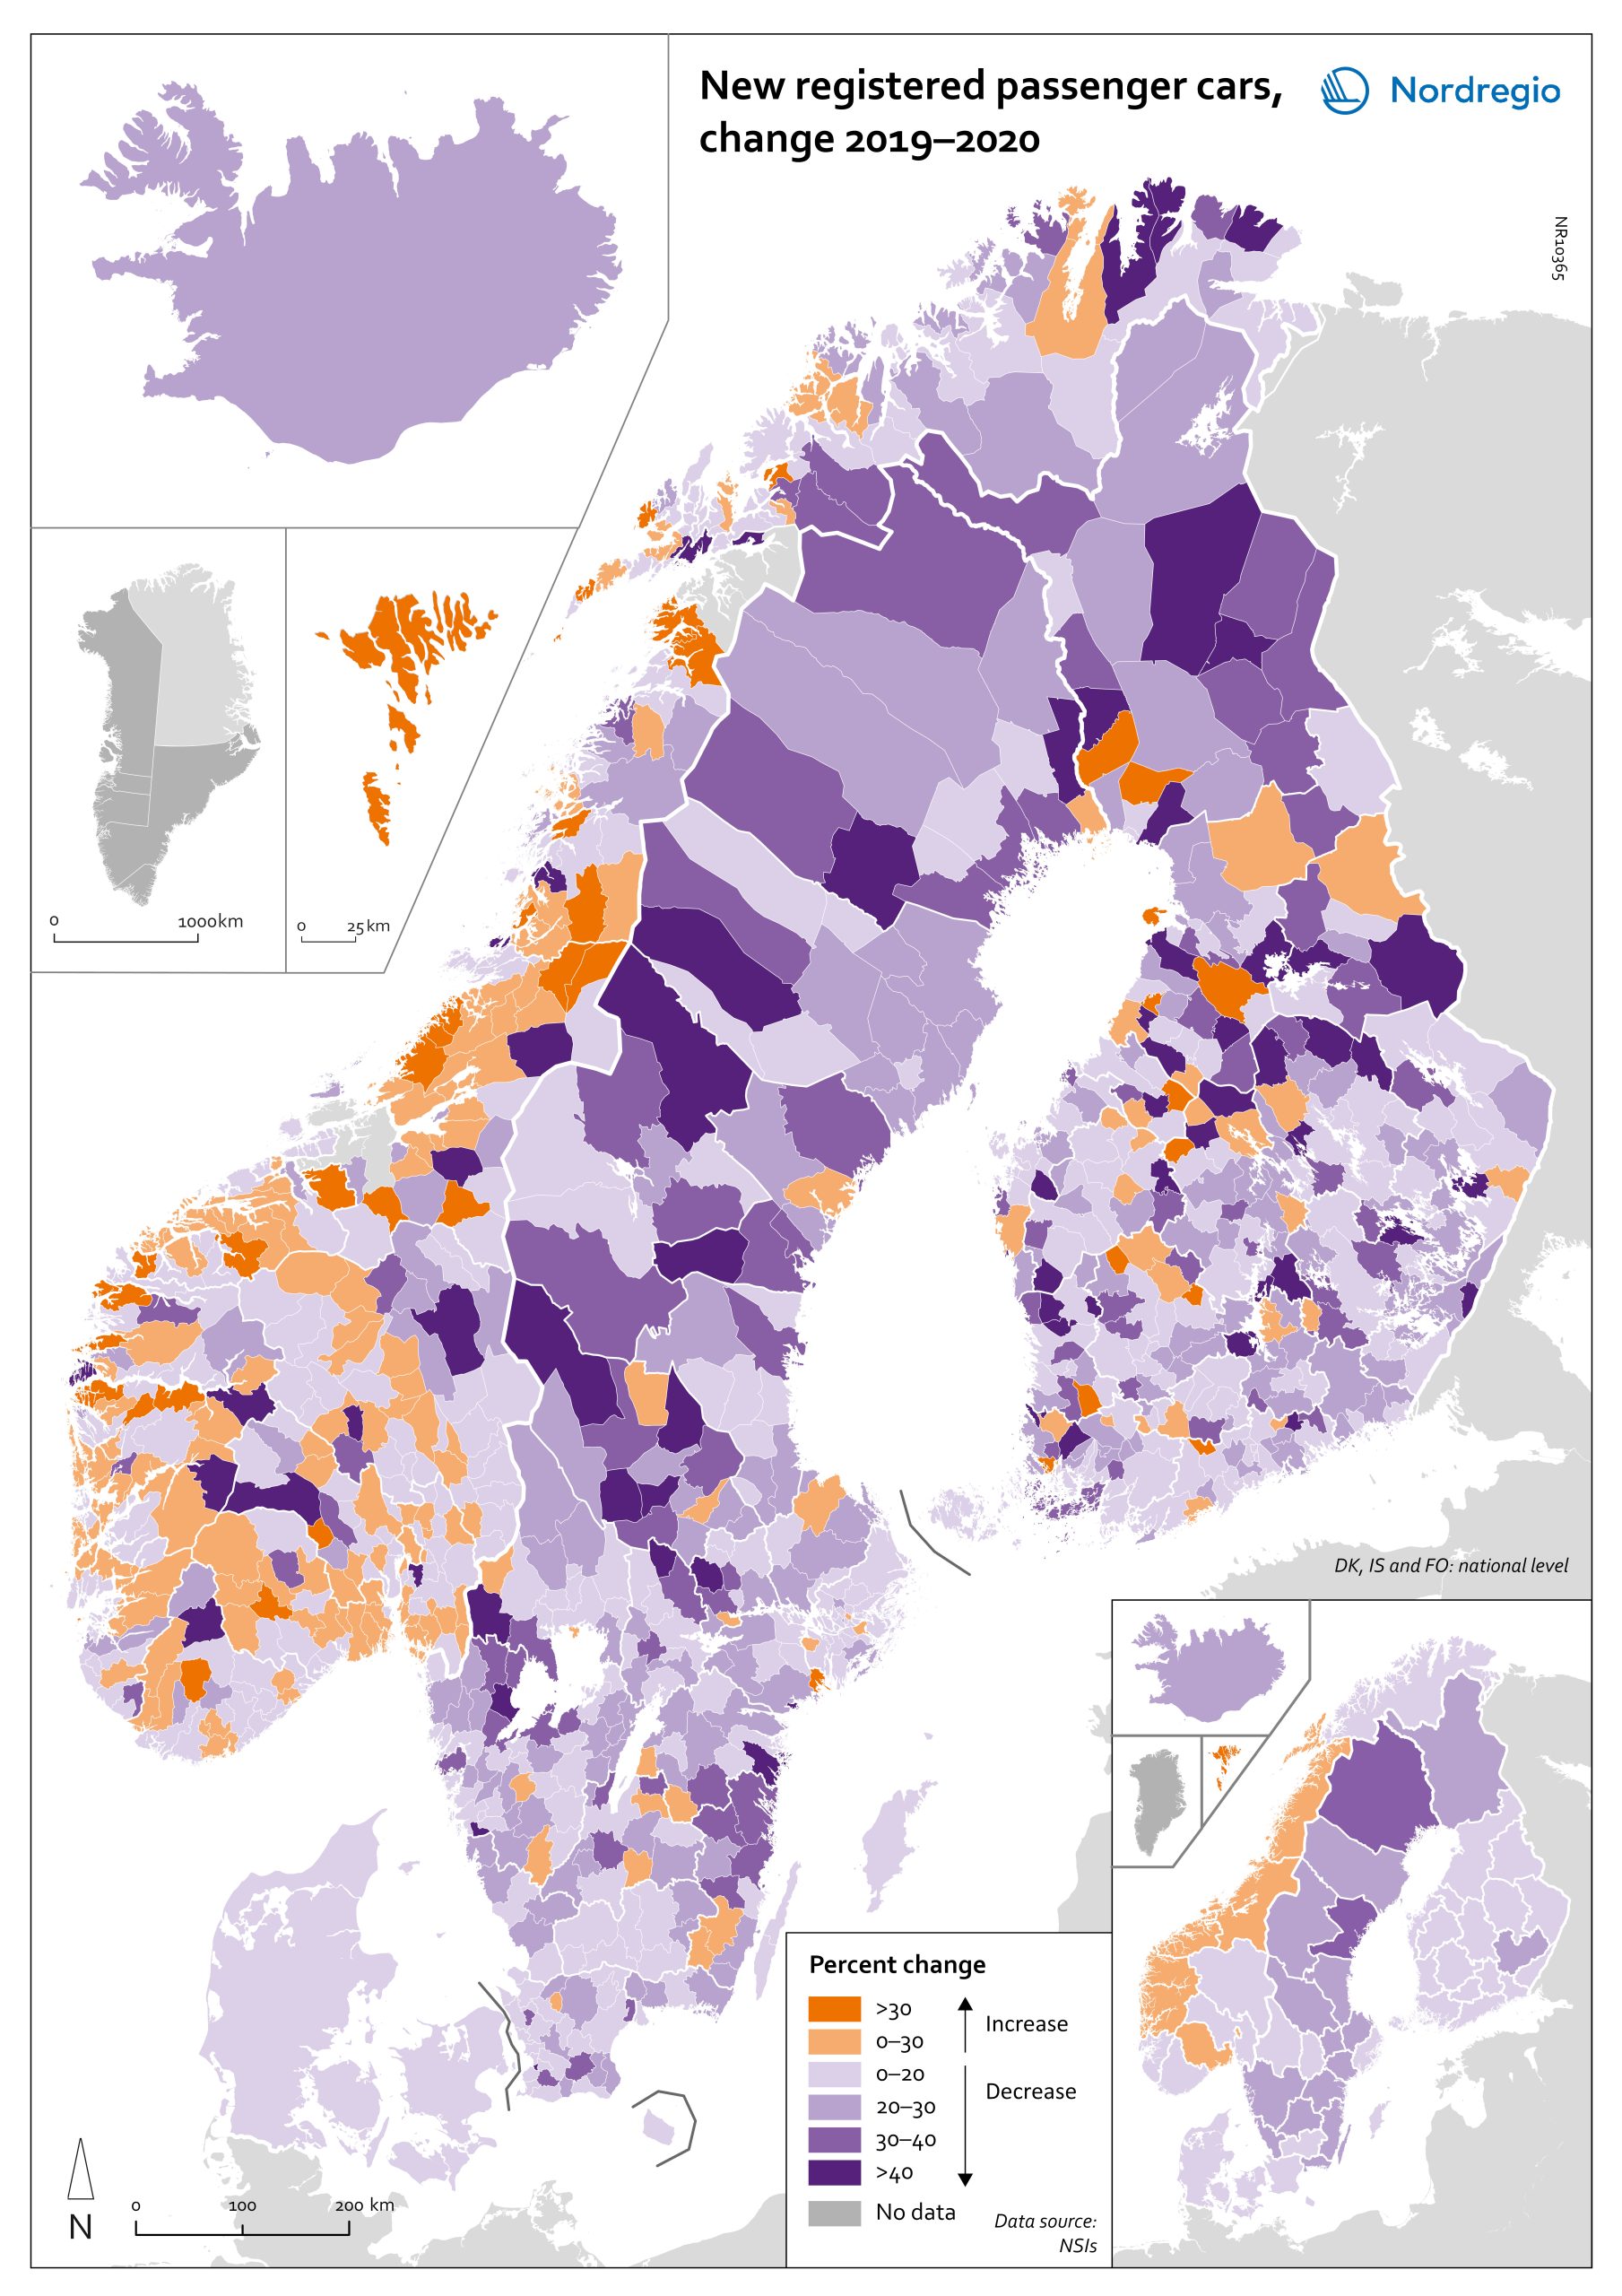
Change in new registered cars 2019-2020
The map shows the change in new registered passenger cars from 2019 to 2020. In most countries, the number of car registrations fell in 2020 compared to 2019. On a global scale, it is estimated that sales of motor vehicles fell by 14%. In the EU, passenger car registrations during the first three quarters of 2020 dropped by 28.8%. The recovery of consumption during Q4 2020 brought the total contraction for the year down to 23.7%, or 3 million fewer cars sold than in 2019. In the Nordic countries, consumer behaviour was consistent overall with the EU and the rest of the world. However, Iceland, Sweden, Finland, Åland, and Denmark recorded falls of 22%–11% – a far more severe decline than Norway, where the market only fell by 2.0%. The Faroe Islands was the only Nordic country to record more car registrations, up 15.8% in 2020 compared to 2019. In Finland, Iceland, Norway, and Sweden, there were differences in car registrations in different parts of the country. In Sweden and Finland, the position was more or less the same in the whole of the country, with only a few municipalities sticking out. In Finland and Sweden, net increases in car registrations were concentrated in rural areas, while in major urban areas, such as Uusimaa-Nyland in Finland and Västra Götaland and Stockholm in Sweden, car sales fell between 10%–22%. Net increases in Norway were recorded in many municipalities throughout the whole country in 2020 compared to 2019.
2022 March
- Economy
- Nordic Region
- Transport
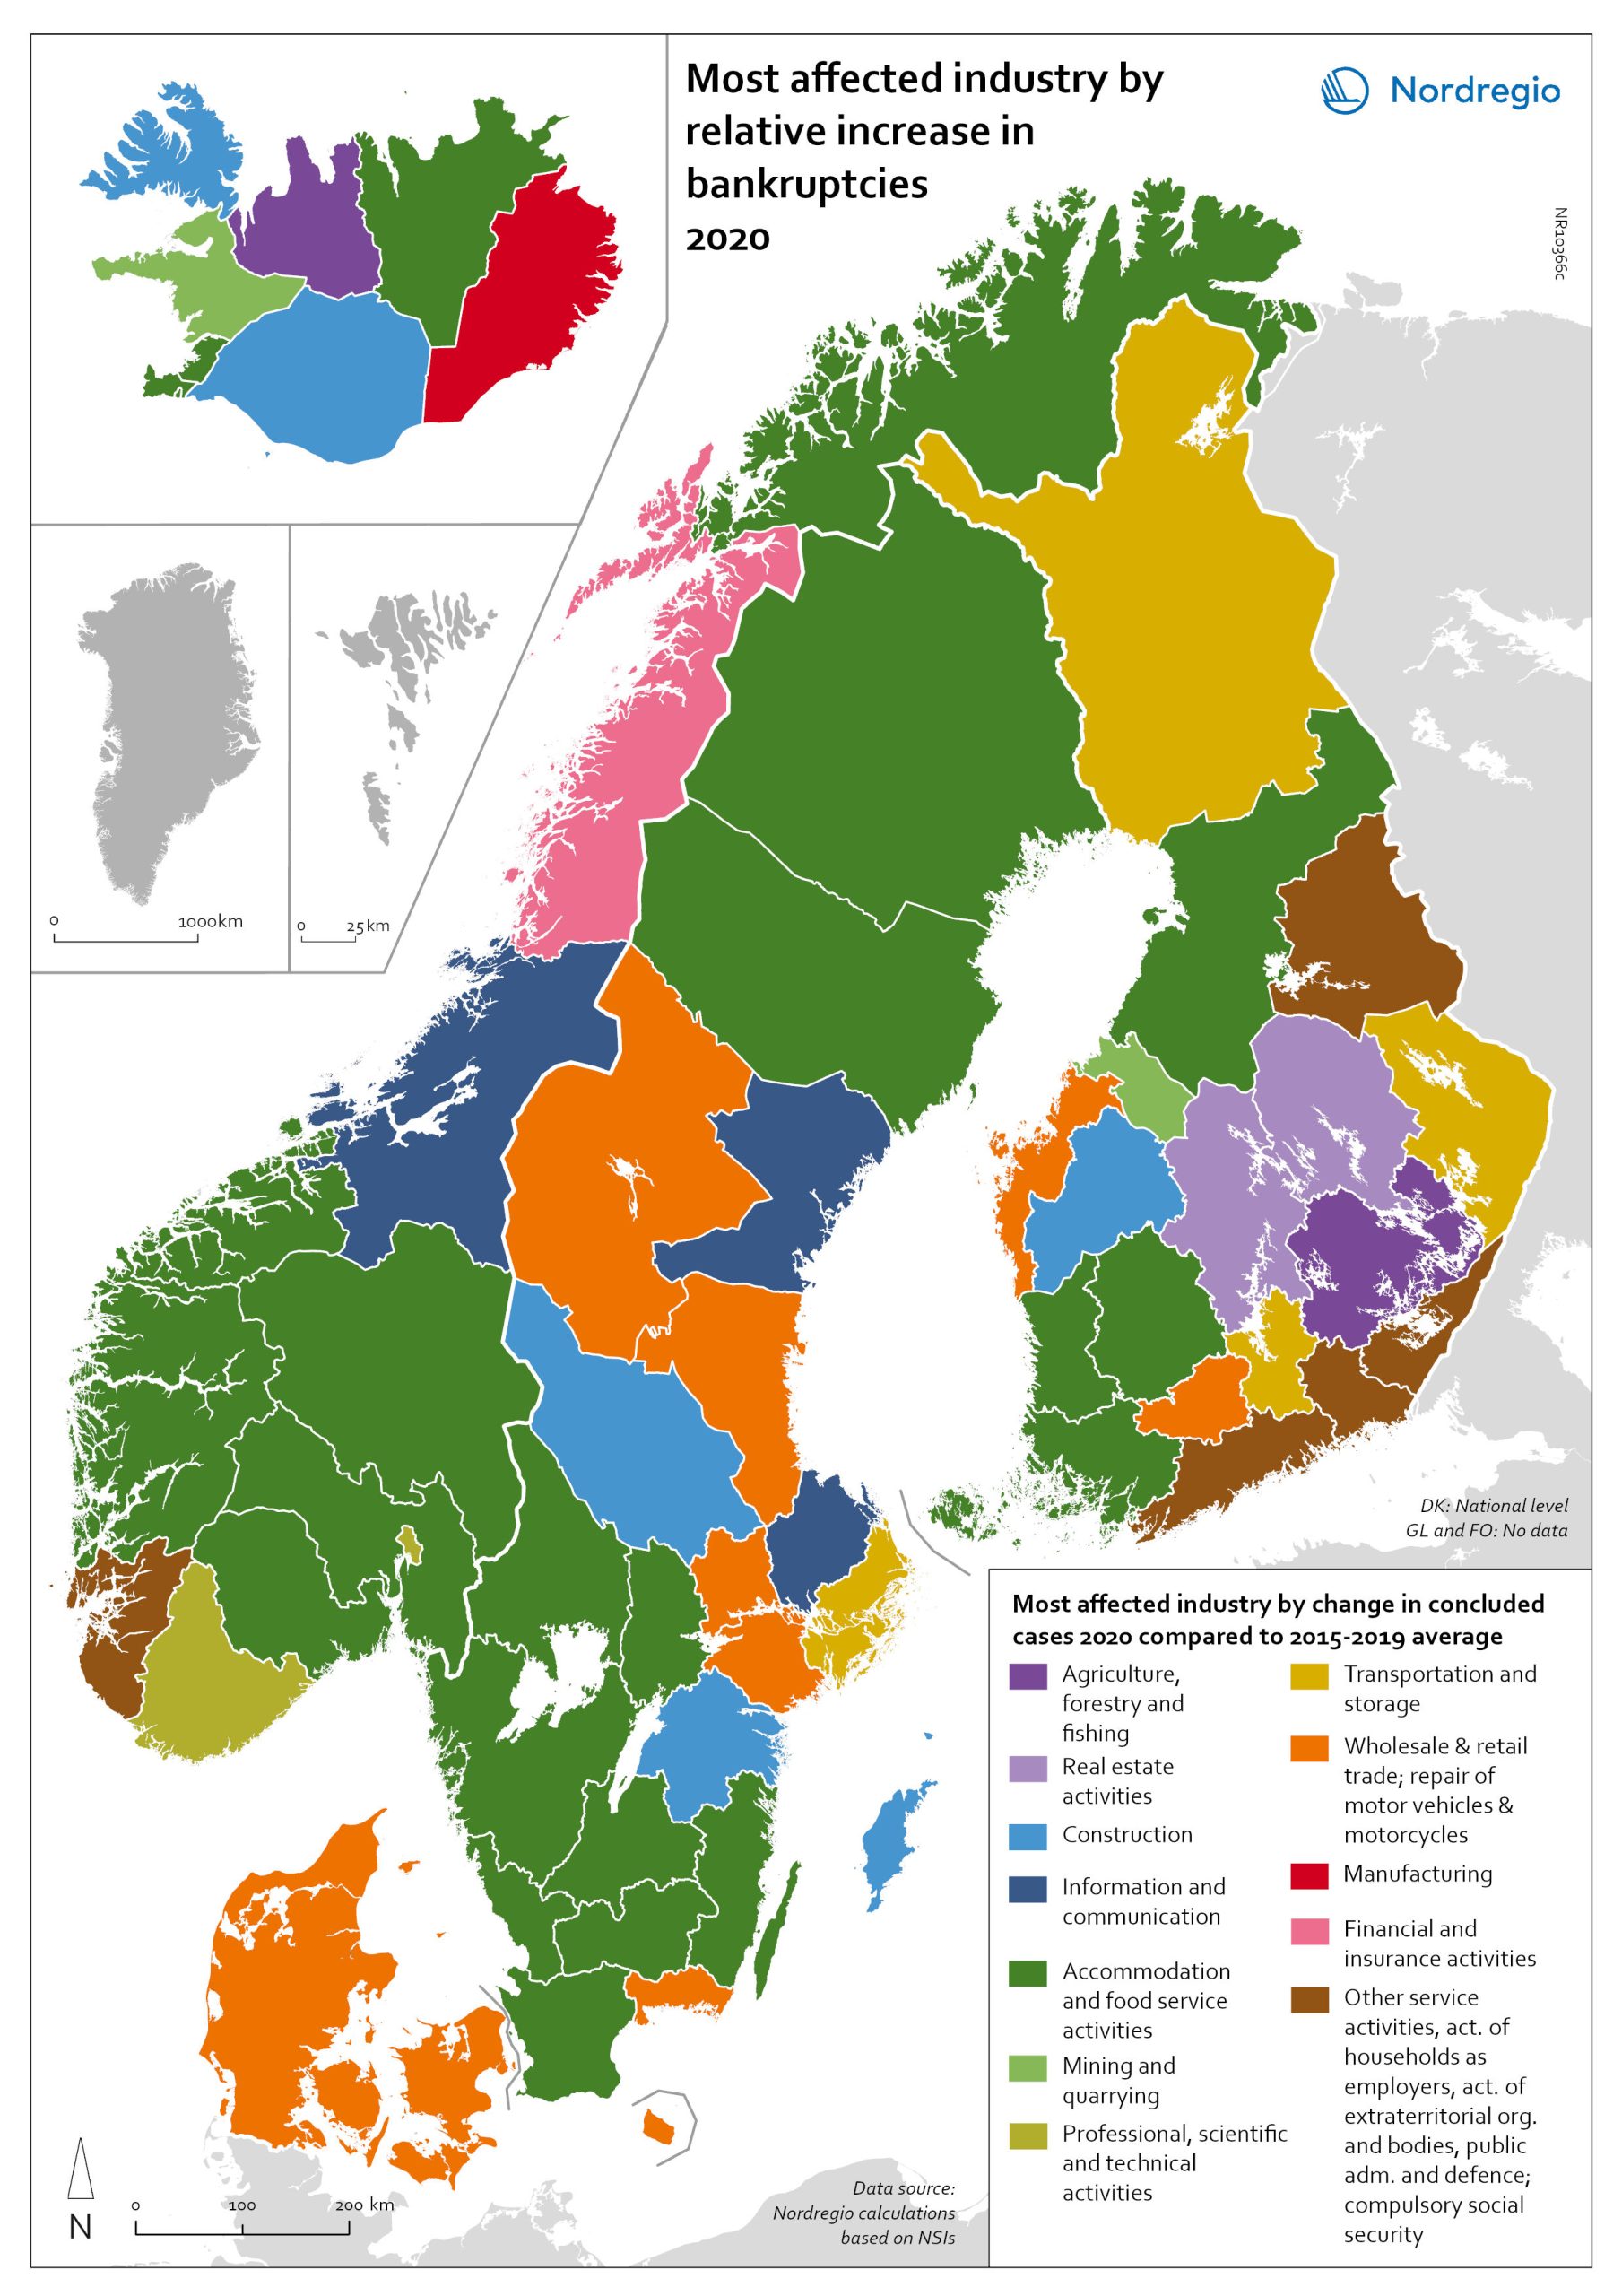
Bankruptcies in 2020 by industry and region
The map shows the most affected industry by relative increase in concluded business bankruptcies 2020 compared to 2015–2019 average. Regional patterns in business failures are linked to factors ranging from the effectiveness of the measures adopted by the various governments to the exposure of regional economies to vulnerable sectors. Regions with higher numbers of bankruptcies tend to reflect the concentration of economic activity in sectors particularly affected by the pandemic. It comes as little surprise that Accommodation and food service activities were the industries with the largest increase in business bankruptcies in 2020 compared to the 2015–2019 baseline. In the Nordic Region as a whole, the number rose by 28.6%. This pattern is also discernible at the regional level. Hotels and restaurants were the activities with the biggest increase in the number of bankruptcies in a significant number of Swedish, Norwegian and Finnish regions. Other sectors suffering higher-than-average numbers of business bankruptcies are service industries, particularly those requiring closer social interaction, like Education (16.5% increase), Other service activities (12.0% increase) and Administrative and support service activities (7.9% increase). The logistics sector was also greatly affected, with major impact localised around logistics centres and transport nodes in the different countries. In the capital regions of Oslo, Stockholm and Helsinki, Transportation and storage was the sector with the largest increase in bankruptcies. Wholesale and retail trade; repair of motor vehicles and motorcycles was the industry to suffer the most in Denmark and several Finnish and Swedish regions.
2022 March
- Economy
- Nordic Region
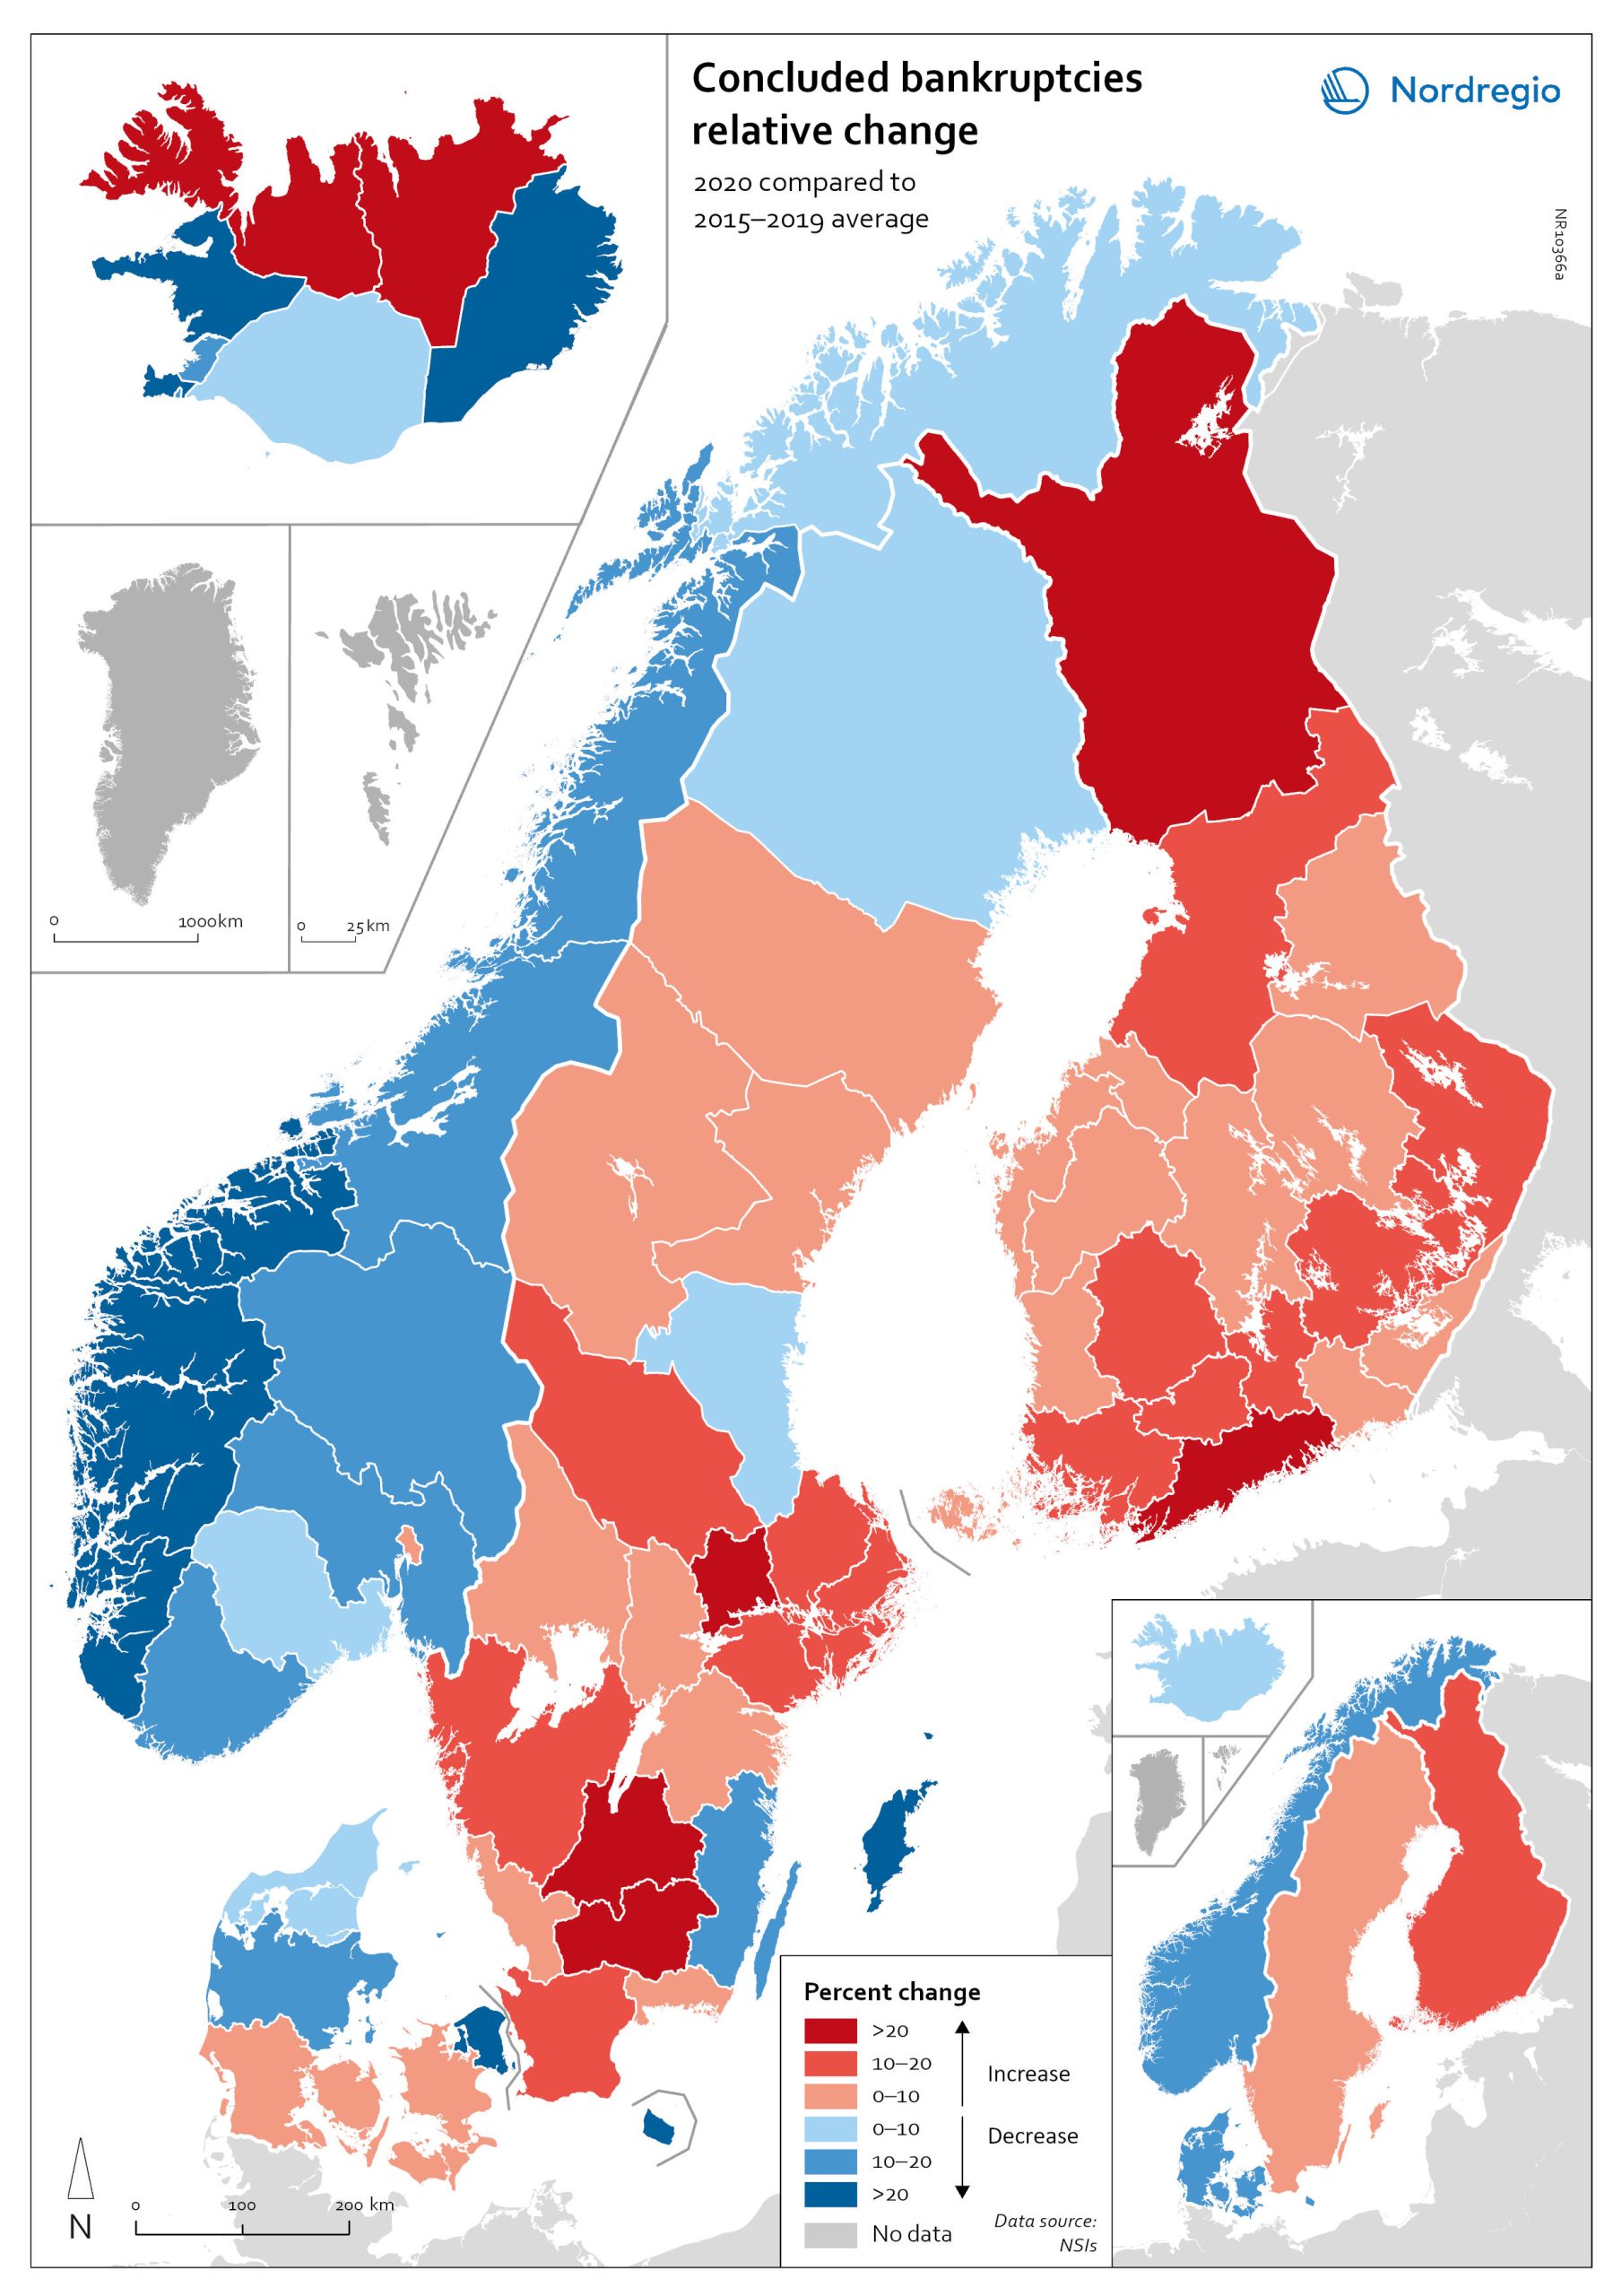
Relative change in the number of business bankruptcies
The map shows the relative change in the number of concluded business bankruptcies by region, 2015–2019 average compared to 2020. At sub-national levels, the distribution of business bankruptcies does not show a clear territorial pattern. In Iceland and Denmark, businesses in the most urbanised areas, including the capital regions, seem to have been those that benefited most from the economic mitigation measures (-23.9% in Höfuðborgarsvæðið and -24.4% in Region Hovedstaden). By contrast, Oslo is the only Norwegian region where there were more business bankruptcies in 2020 compared to the 2015–2019 baseline (1.9% increase). Most Norwegian regions did, in fact, have fewer bankruptcies in 2020, particularly in the western regions. One plausible explanation for this could be that the number of business failures during the baseline period was especially high in western Norway due to the fall in oil prices in 2014–2015. In Sweden the situation is even more mixed. Here, businesses in urban areas seem to have been more exposed to the distress caused by the Covid-19 pandemic. The most urbanised regions in the Stockholm-Gothenburg-Malmö corridor registered a greater increase in liquidations (Jönköping, Kronoberg and Södermanland regions saw surges of around 20%). However, predominantly rural regions in Sweden, such as Västerbotten and Jämtland, also recorded higher numbers of bankruptcies than average (9.8% and 8.8% increase, respectively). In Finland, the impact was greater in Lapland (26.9%) and around Helsinki (Uusimaa, 25.9%) than in the central parts of the country. Åland also experienced a moderate rise in business bankruptcies in 2020 (4.0%), mostly related to the tourism sector.
2022 March
- Economy
- Nordic Region
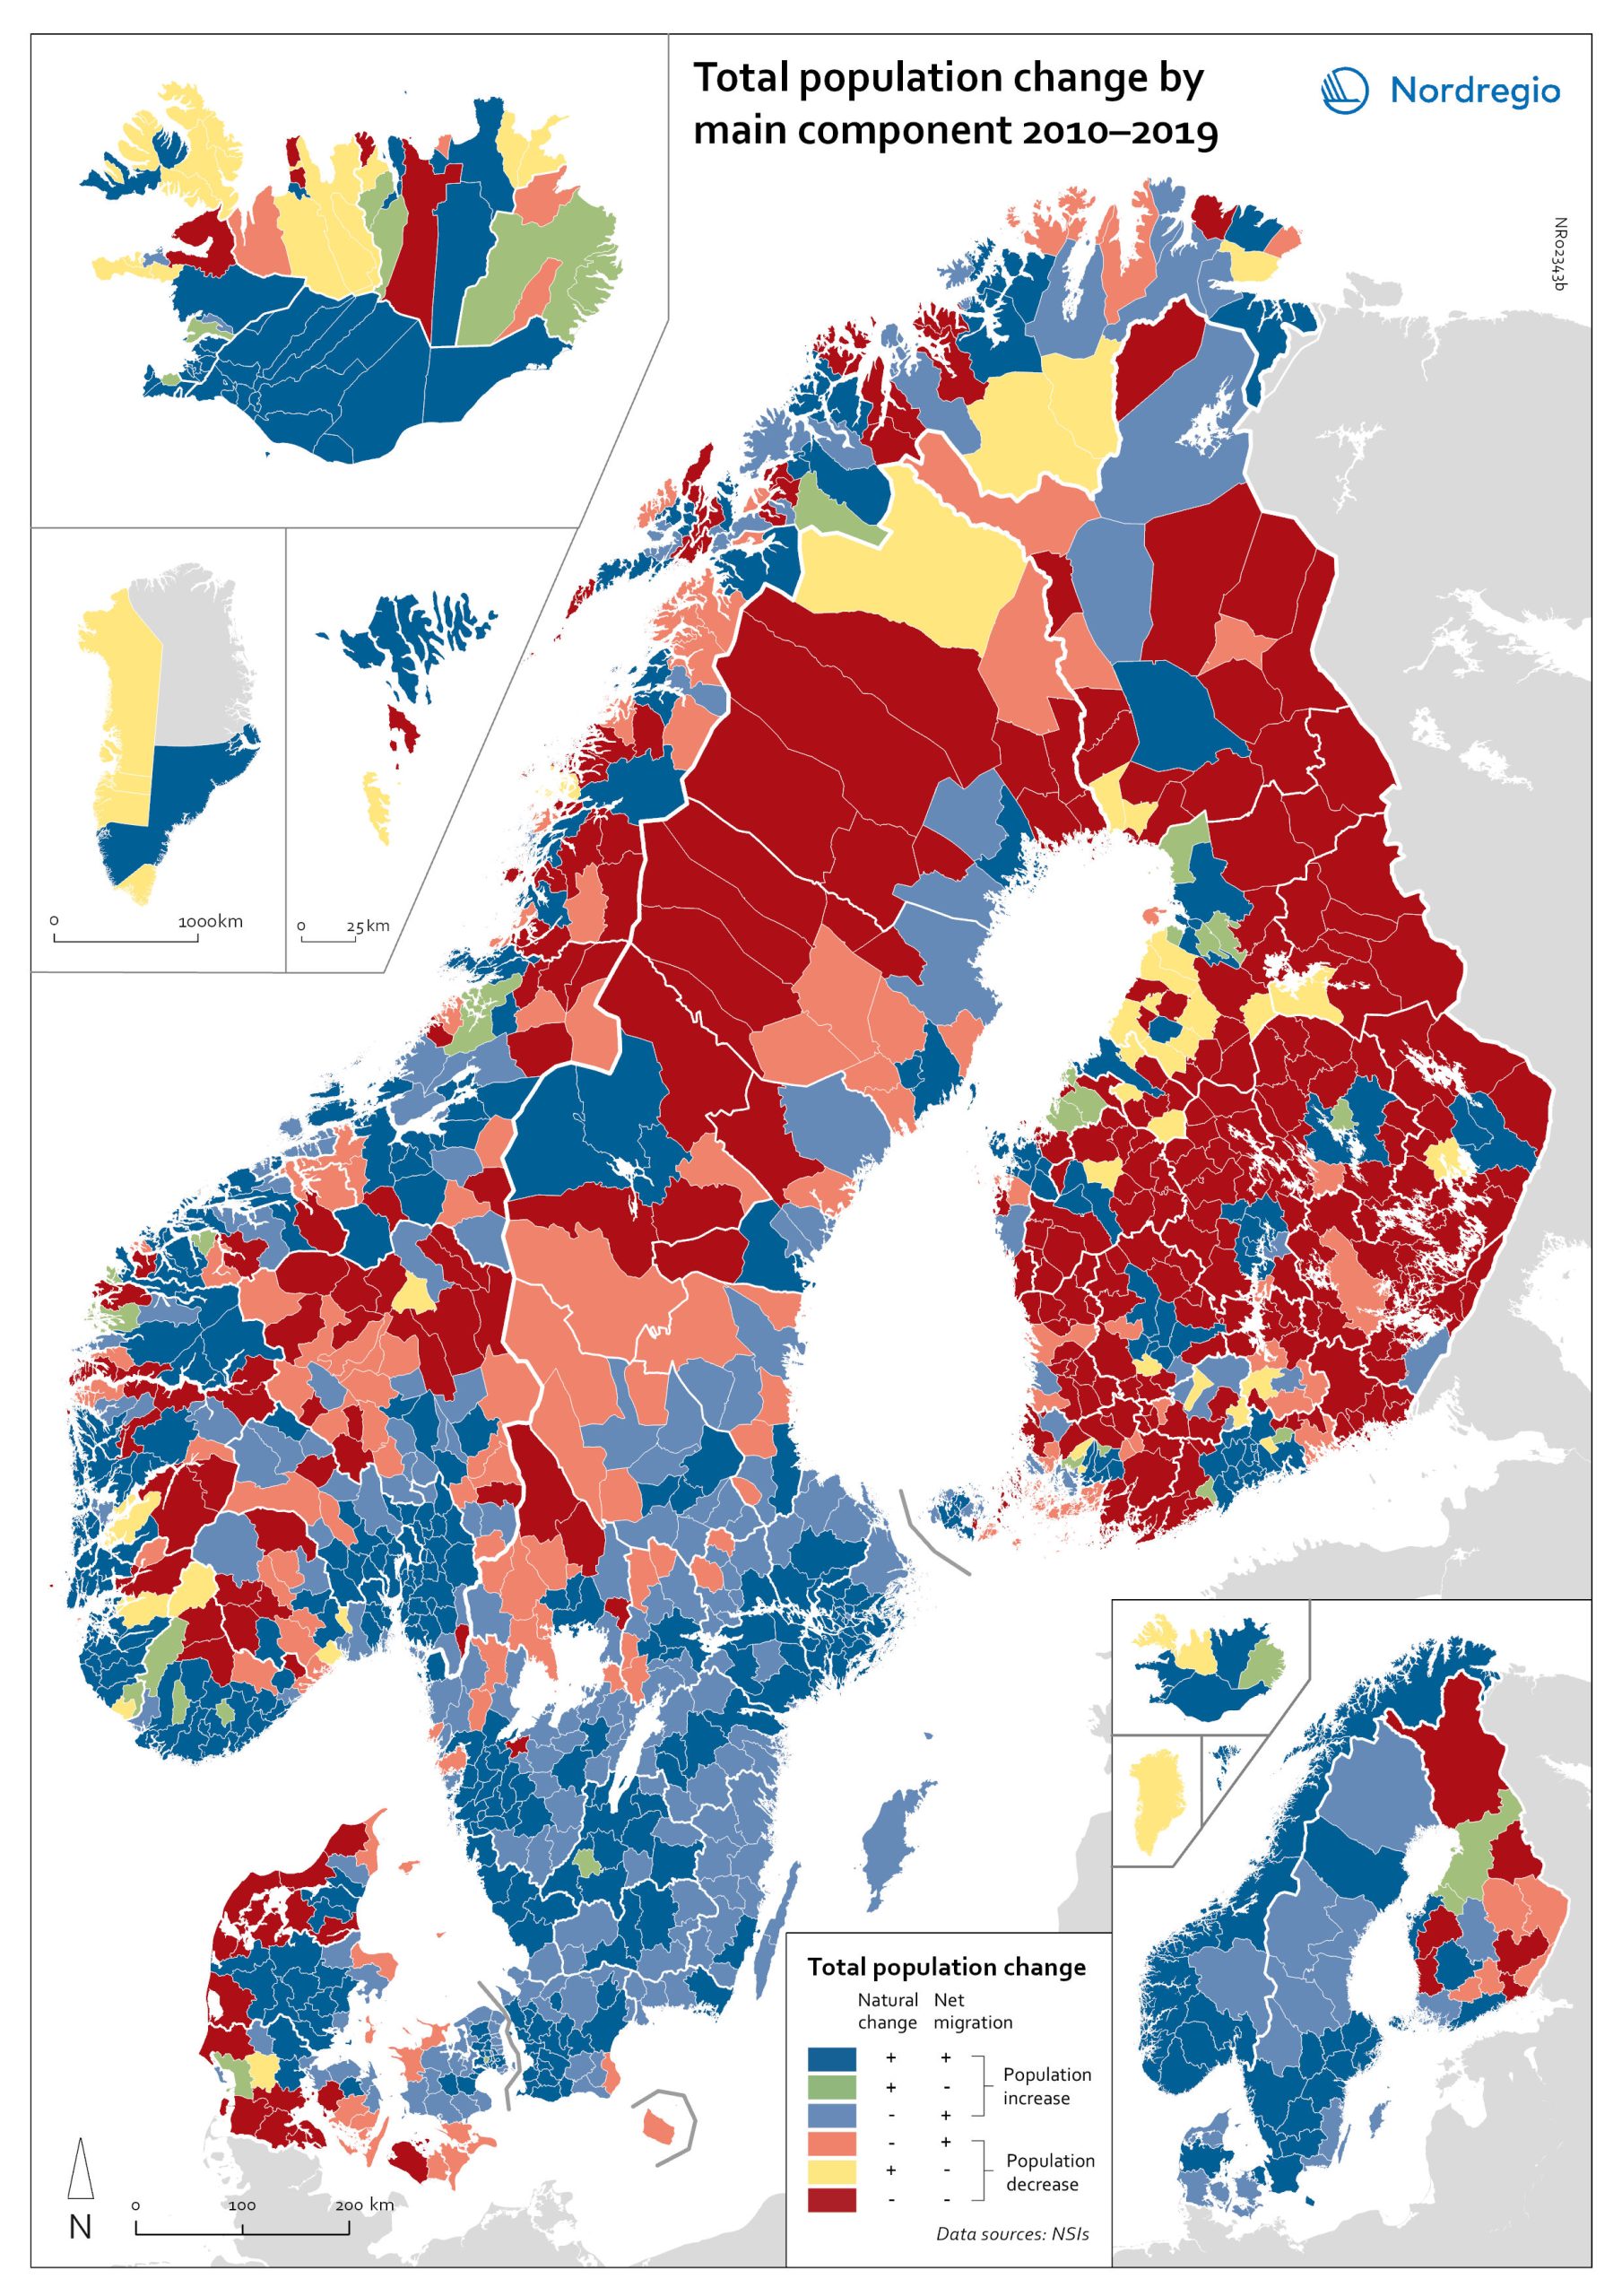
Population change by component 2010-2019
The map shows the population change by component 2010-2019. The map is related to the same map showing regional and municipal patterns in population change by component in 2020. Regions are divided into six classes of population change. Those in shades of blue or green are where the population has increased, and those in shades of red or yellow are where the population has declined. At the regional level (see small inset map), all in Denmark, all in the Faroes, most in southern Norway, southern Sweden, all but one in Iceland, all of Greenland, and a few around the capital in Helsinki had population increases in 2010-2019. Most regions in the north of Norway, Sweden, and Finland had population declines in 2010-2019. Many other regions in southern and eastern Finland also had population declines in 2010-2019, mainly because the country had more deaths than births, a trend that pre-dated the pandemic. In 2020, there were many more regions in red where populations were declining due to both natural decrease and net out-migration. At the municipal level, a more varied pattern emerges, with municipalities having quite different trends than the regions of which they form part. Many regions in western Denmark are declining because of negative natural change and outmigration. Many smaller municipalities in Norway and Sweden saw population decline from both negative natural increase and out-migration despite their regions increasing their populations. Many smaller municipalities in Finland outside the three big cities of Helsinki, Turku, and Tampere also saw population decline from both components. A similar pattern took place at the municipal level in 2020 of there being many more regions in red than in the previous decade.
2022 March
- Demography
- Migration
- Nordic Region
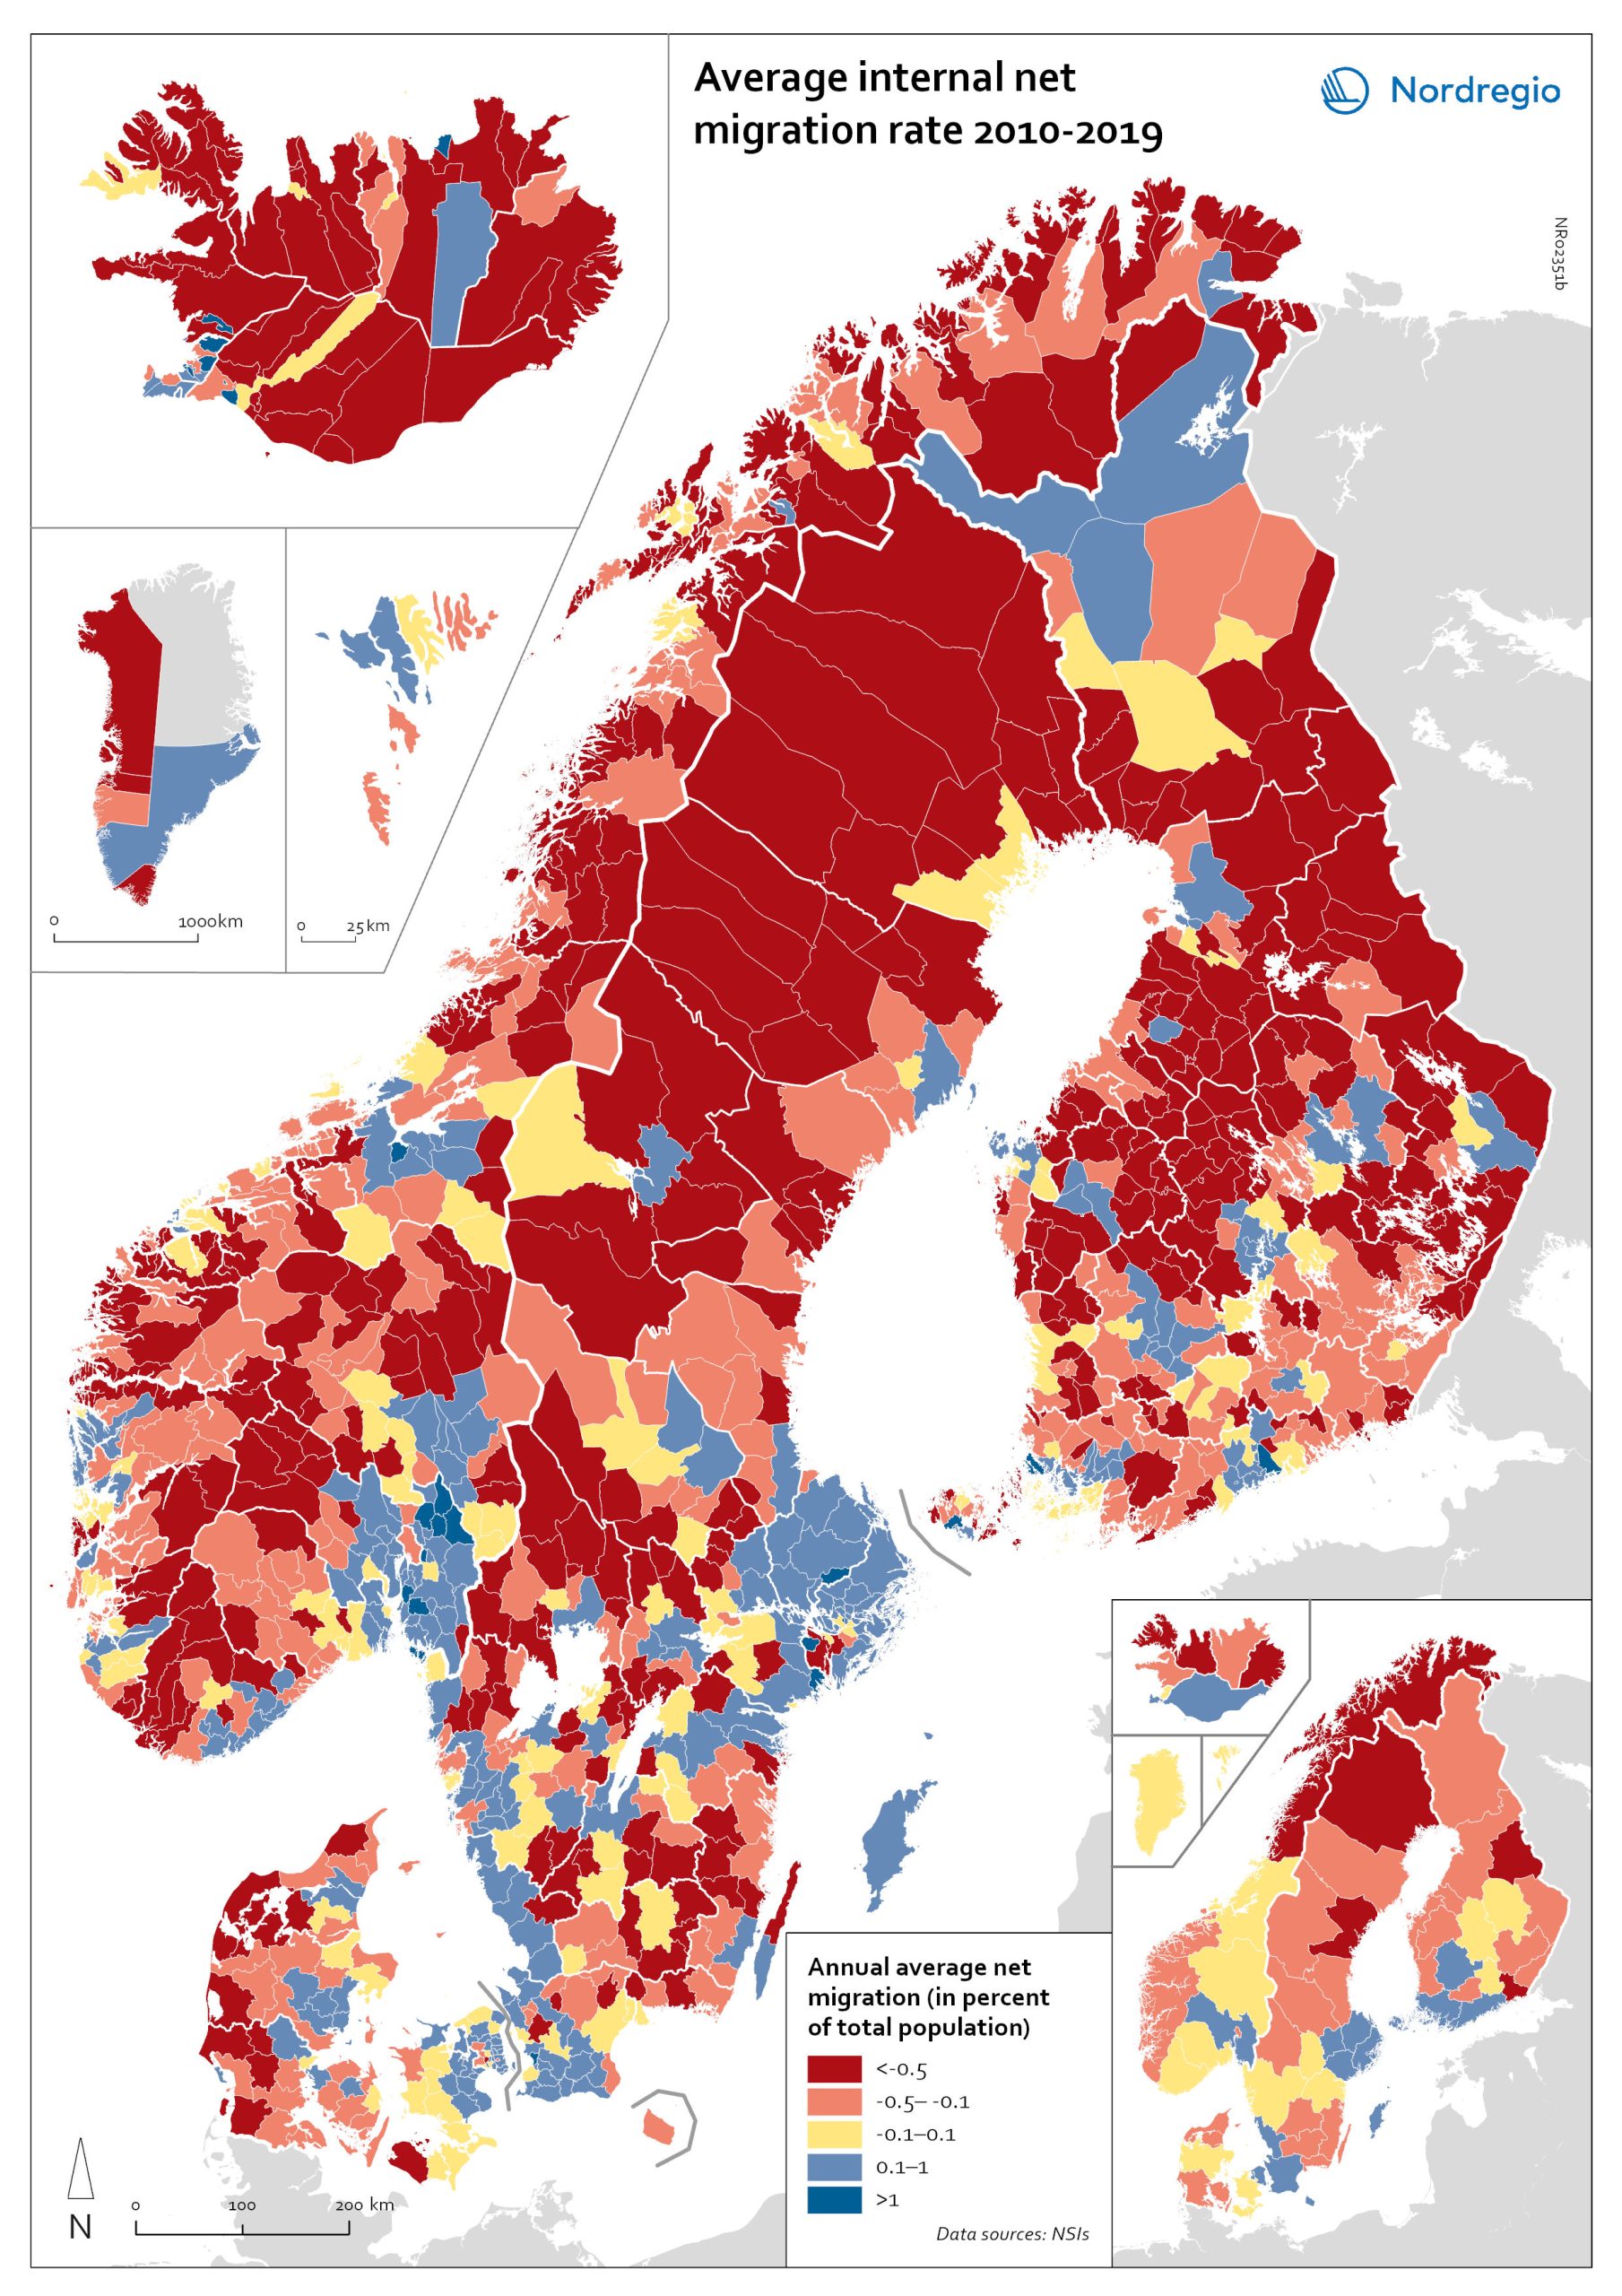
Net internal migration rate, 2010-2019
The map shows the annual average internal net migration in 2010-2019. The map is related to the same map showing net internal migration in 2020. The maps show several interesting patterns, suggesting that there may be an increasing trend towards urban-to-rural countermigration in all the five Nordic countries because of the pandemic. In other words, there are several rural municipalities – both in sparsely populated areas and areas close to major cities – that have experienced considerable increases in internal net migration. In Finland, for instance, there are several municipalities in Lapland that attracted return migrants to a considerable degree in 2020 (e.g., Kolari, Salla, and Savukoski). Swedish municipalities with increasing internal net migration include municipalities in both remote rural regions (e.g., Åre) and municipalities in the vicinity of major cities (e.g., Trosa, Upplands-Bro, Lekeberg, and Österåker). In Iceland, there are several remote municipalities that have experienced a rapid transformation from a strong outflow to an inflow of internal migration (e.g., Ásahreppur, Tálknafjarðarhreppurand, and Fljótsdalshreppur). In Denmark and Norway, there are also several rural municipalities with increasing internal net migration (e.g., Christiansø in Denmark), even if the patterns are somewhat more restrained compared to the other Nordic countries. Interestingly, several municipalities in capital regions are experiencing a steep decrease in internal migration (e.g., Helsinki, Espoo, Copenhagen and Stockholm). At regional level, such decreases are noted in the capital regions of Copenhagen, Reykjavík and Stockholm. At the same time, the rural regions of Jämtland, Kalmar, Sjælland, Nordjylland, Norðurland vestra, Norðurland eystra and Kainuu recorded increases in internal net migration. While some of the evolving patterns of counterurbanisation were noted before 2020 for the 30–40 age group, these trends seem to have been strengthened by the pandemic. In addition to return migration, there may be a larger share of young adults who…
2022 March
- Demography
- Migration
- Nordic Region
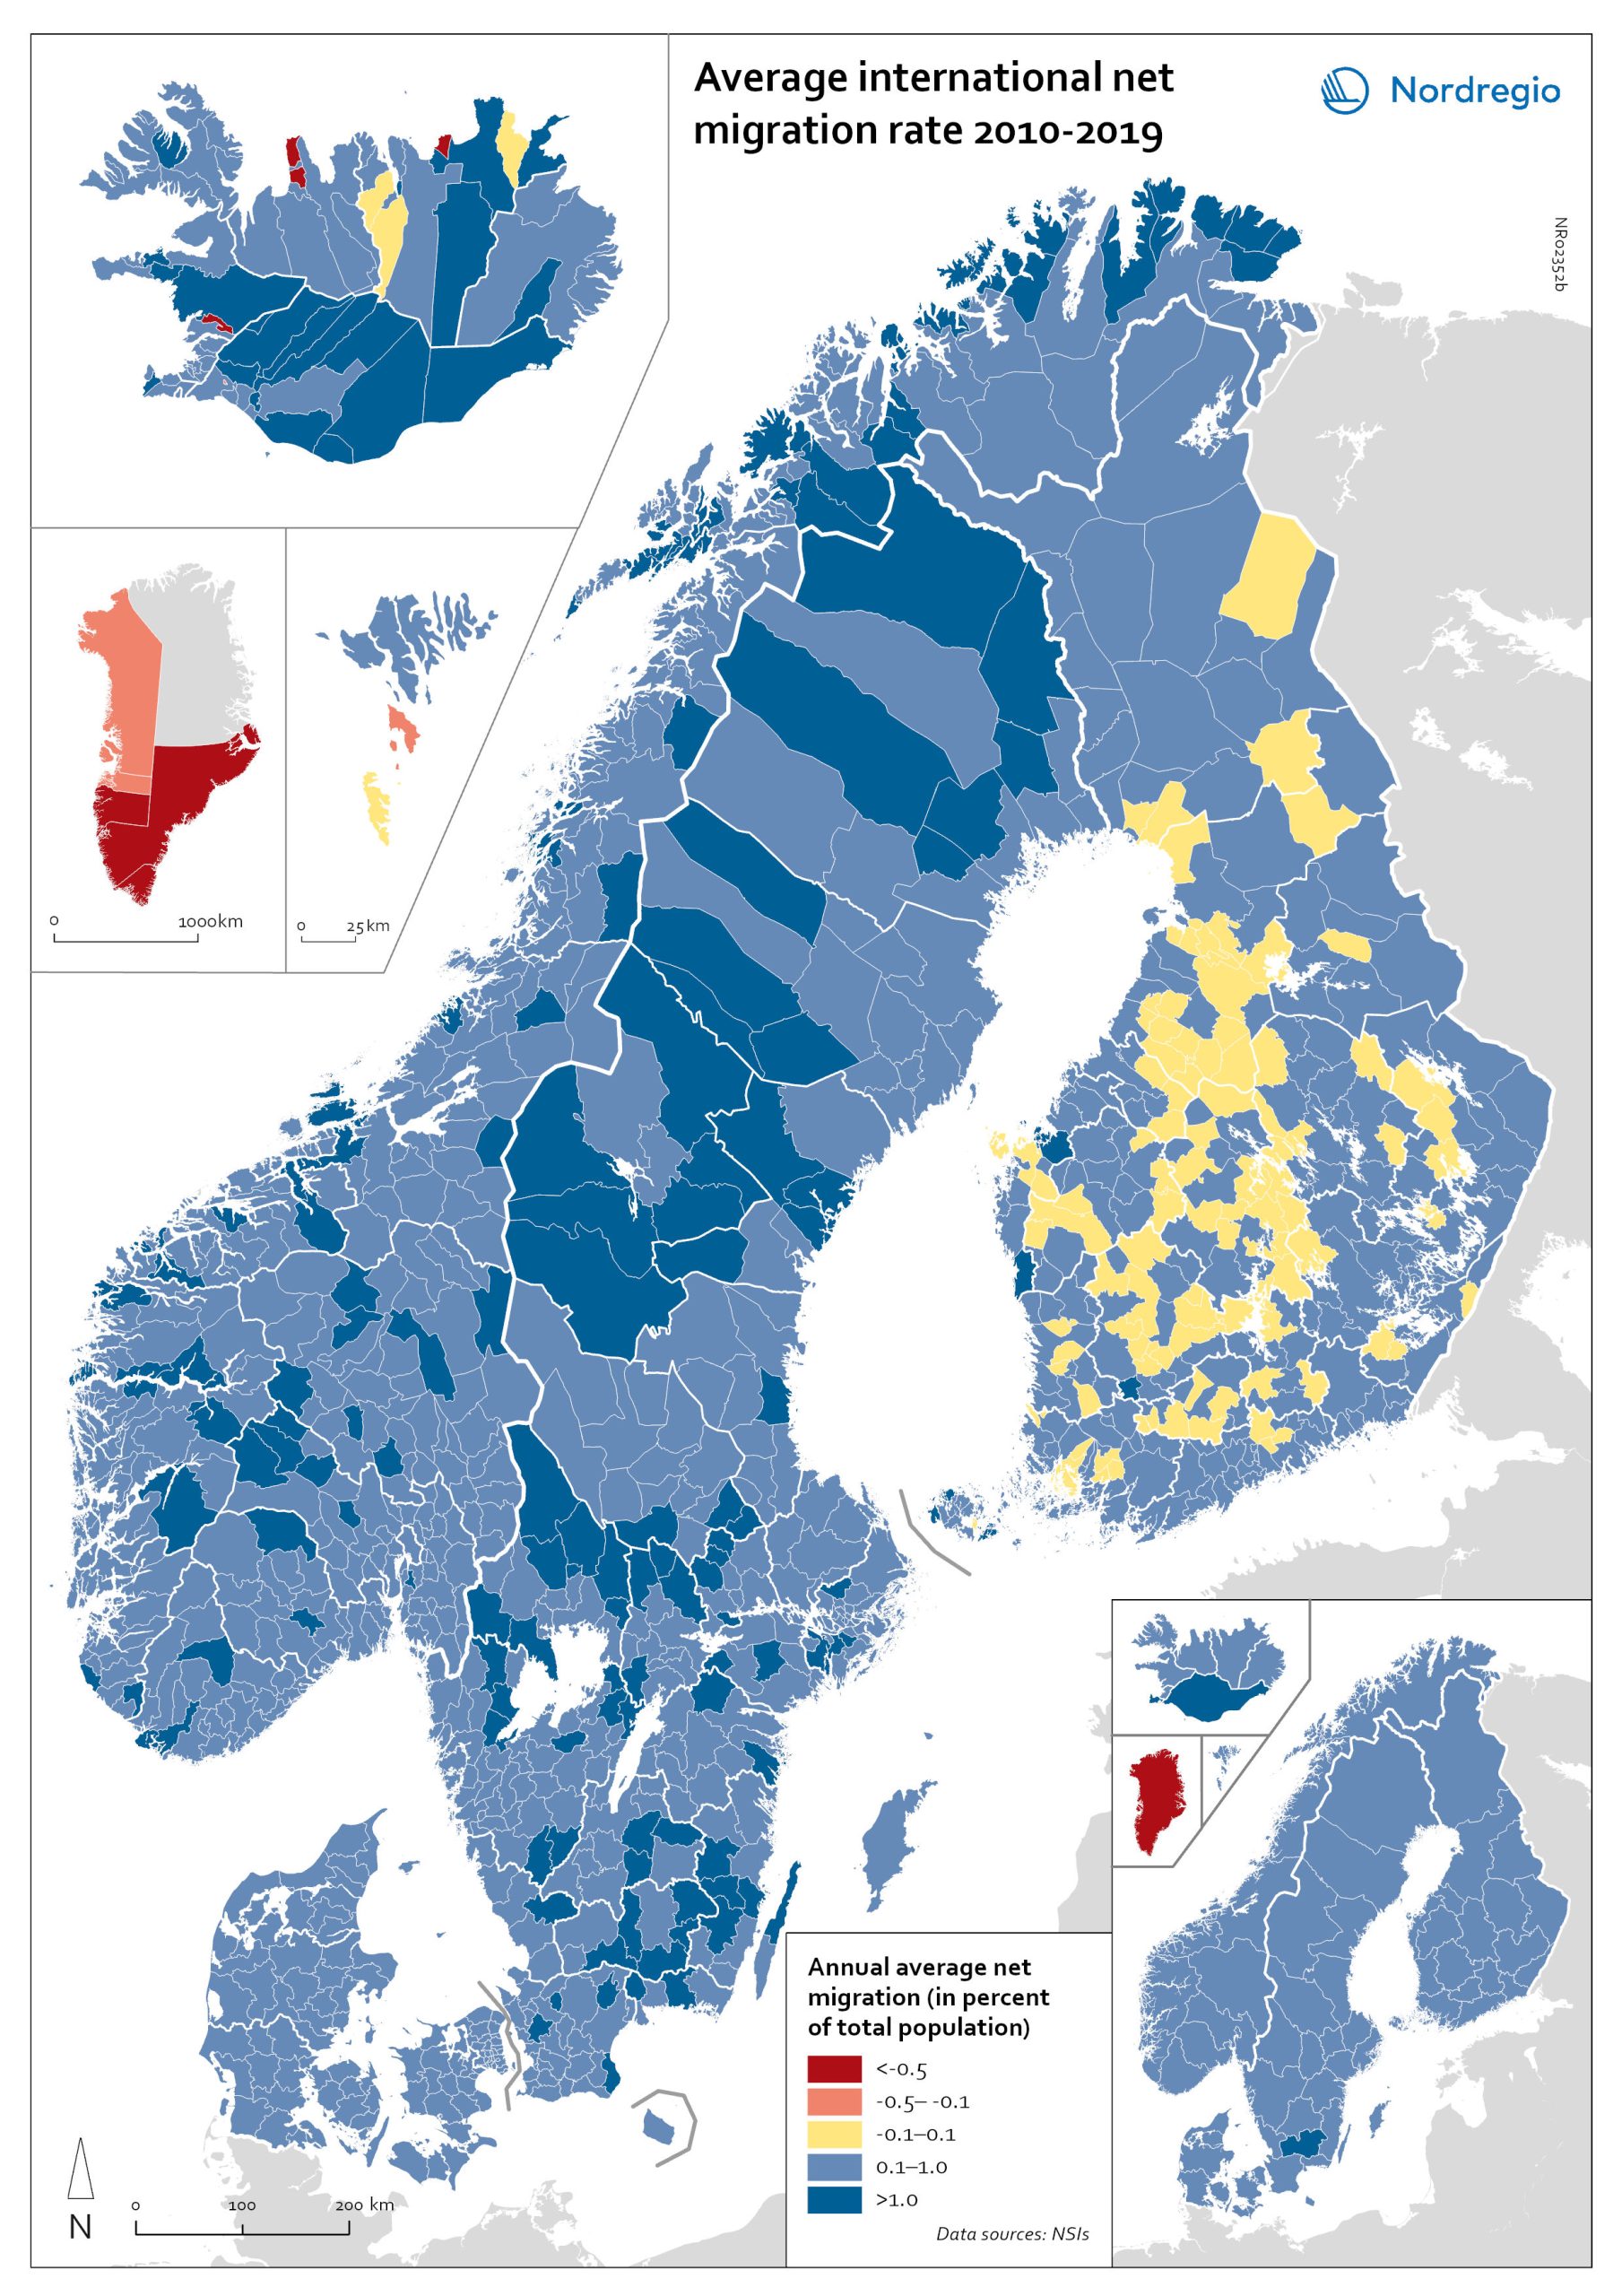
Net international migration rate, 2010–2019
The map shows the annual average international net migration from 2010 to 2019. The map is related to the same map showing net migration in 2020. At regional level, there are only minor changes between the net migration in 2010-2019 and 2020. All regions of Norway, all regions of Sweden except Gotland and Uppsala, and the regions of Österbotten in Finland, Midtjylland in Denmark and Norðurland eystra in Iceland experienced a slight decrease in international net migration I 2020 compared to 2010-2019. There is a more marked increase in net migration in the Faroe Islands, Greenland and the region of Norðurland vestra in Iceland, and a slight increase in the region of Austurland in Iceland. At municipal level, the maps show more changing patterns. In Denmark, Norway and Sweden, several municipalities – both in the capital, intermediate, and rural regions – had lower levels of international net migration in 2020 compared to 2010-2019. In Iceland and Finland, the picture is more balanced, with some municipalities showing a decrease, others an increase. In the Faroe Islands and Greenland, several municipalities/regions had an increase in international net migration.
2022 March
- Demography
- Migration
- Nordic Region
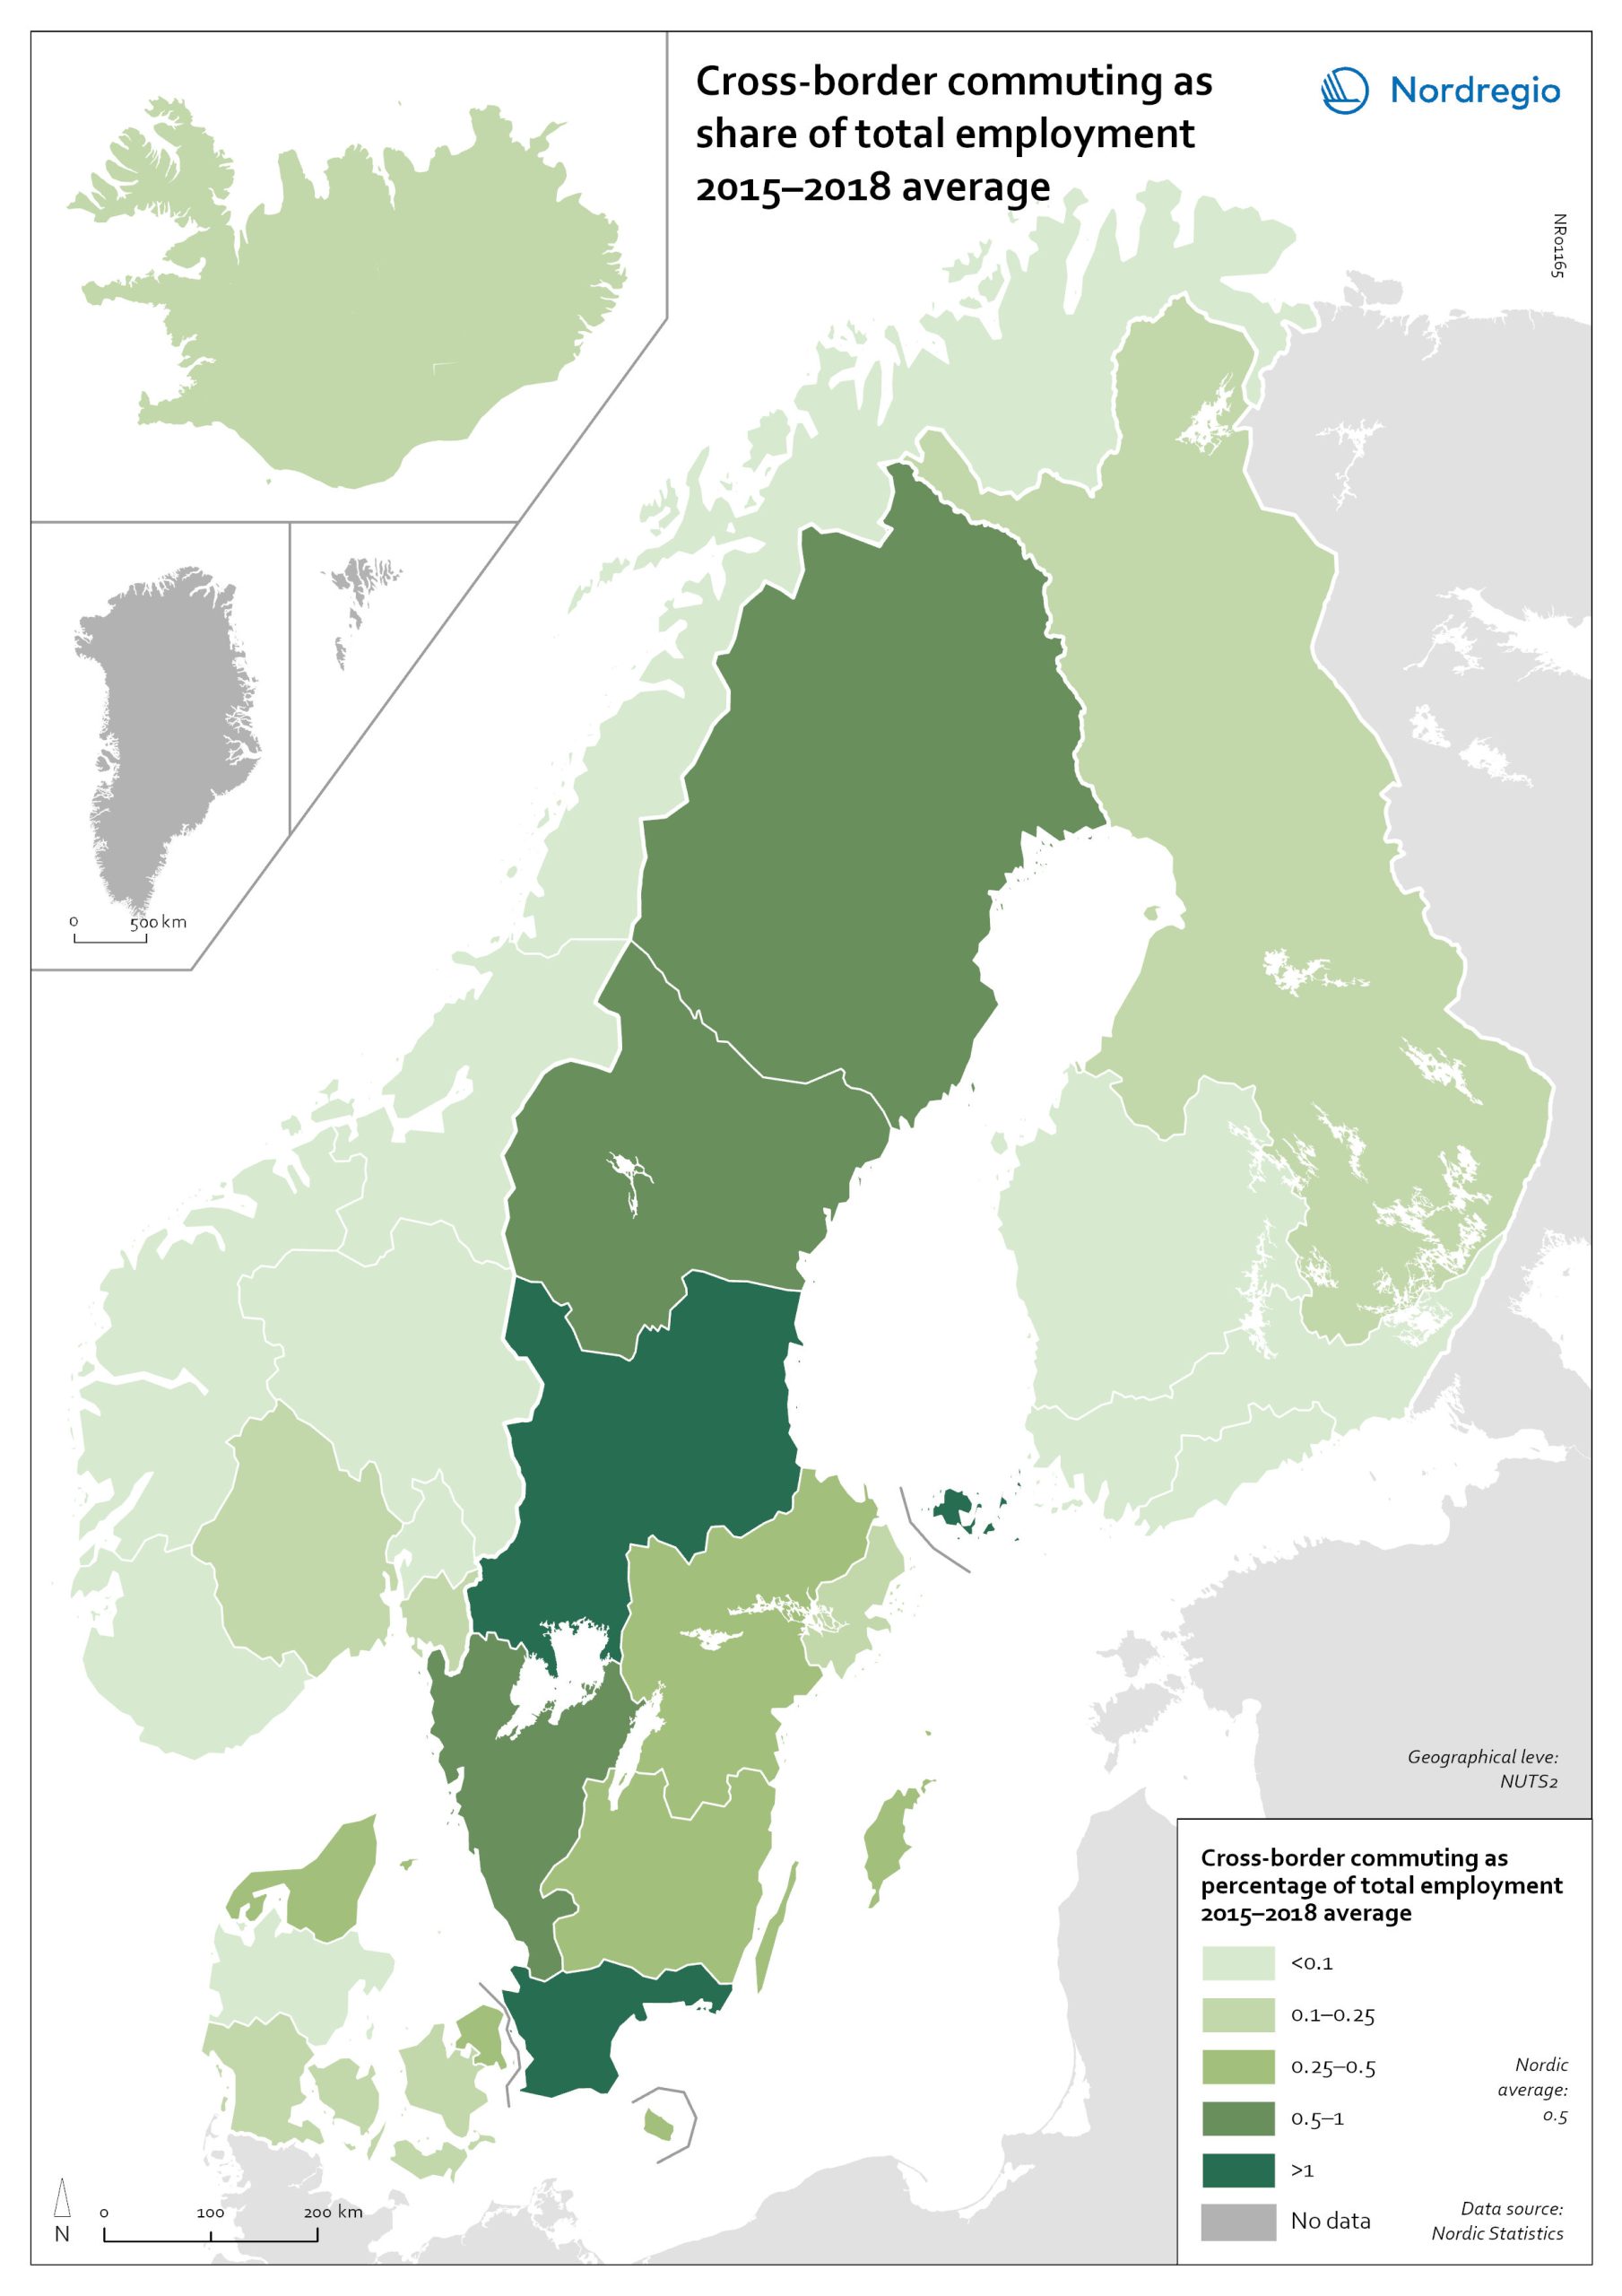
Cross-border commuting as share of employment
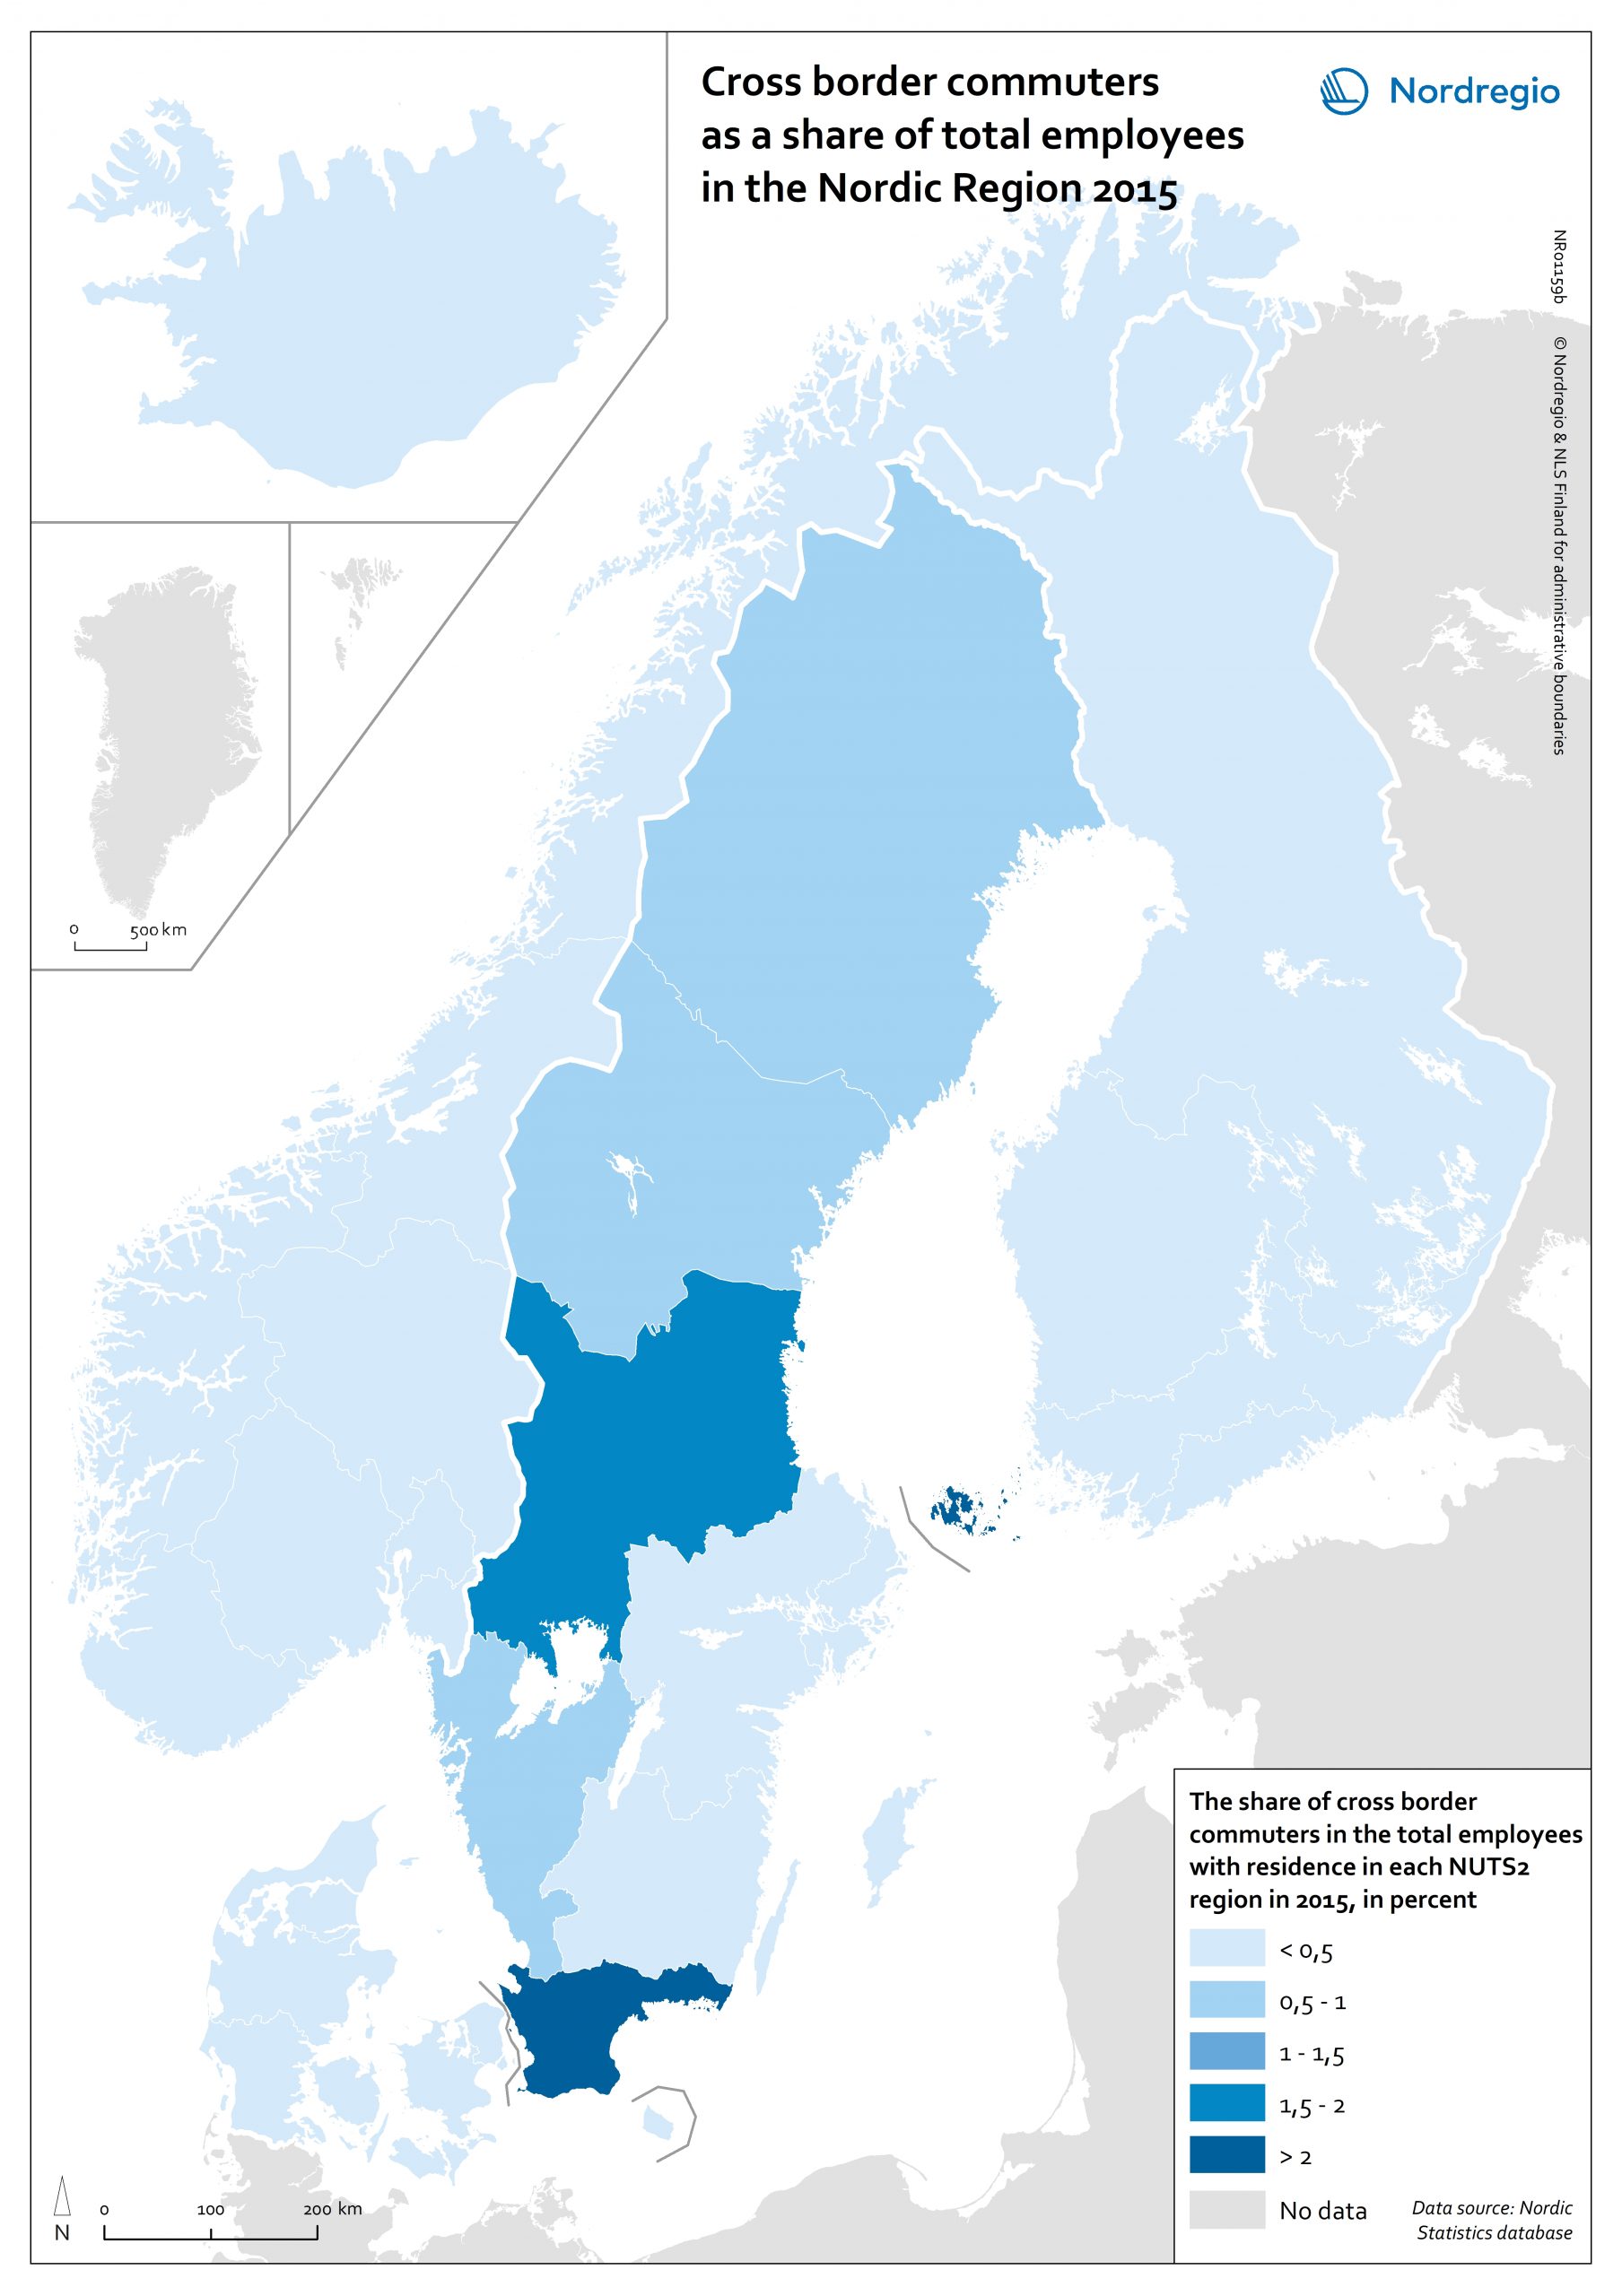
The map illustrates the average share of employees who commuted to another Nordic country between between 2015 and 2018 in Nordic regions (NUTS 2). Between 2015 and 2018, an average of approximately 49,000 people held a job in a Nordic country in which they were not residents. This indicates that, on average, 0.5% of the Nordic working-age population commuted to a job in another Nordic country. This is below the EU27 average of 1%, with the highest numbers found in Slovakia (5.1%), Luxembourg (2.8%) and Estonia (2.6%). Some of these people cross borders daily. Others work in another country by means of remote working combined with occasional commuting across borders. Within the Nordic Region, the largest cross-border commuter flows are in the southernmost parts of Sweden, regions in the middle of Sweden and in Åland, where more than 1% of the working population commutes to another Nordic country. However, there may be individual municipalities where cross-border commuting is substantially higher. For example, the employment rate in Årjäng Municipality, Sweden, increases by 15 percentage points when cross-border commuting is taken into account. These municipalities are not reflected on NUTS 2 level when averages are calculated. In terms of absolute numbers in 2015, the highest numbers of commuters were from Sweden: Sydsverige (16,543), Västsverige (7,899) and Norra Mellansverige (6,890). The highest number of commuters from a non-Swedish region were from Denmark’s Hovedstaden (2,583). Due to legislative barriers regarding the exchange of statistical data on cross-border commuting between the Nordic countries, more recent data is not available.
2022 March
- Labour force
- Nordic Region
- Transport
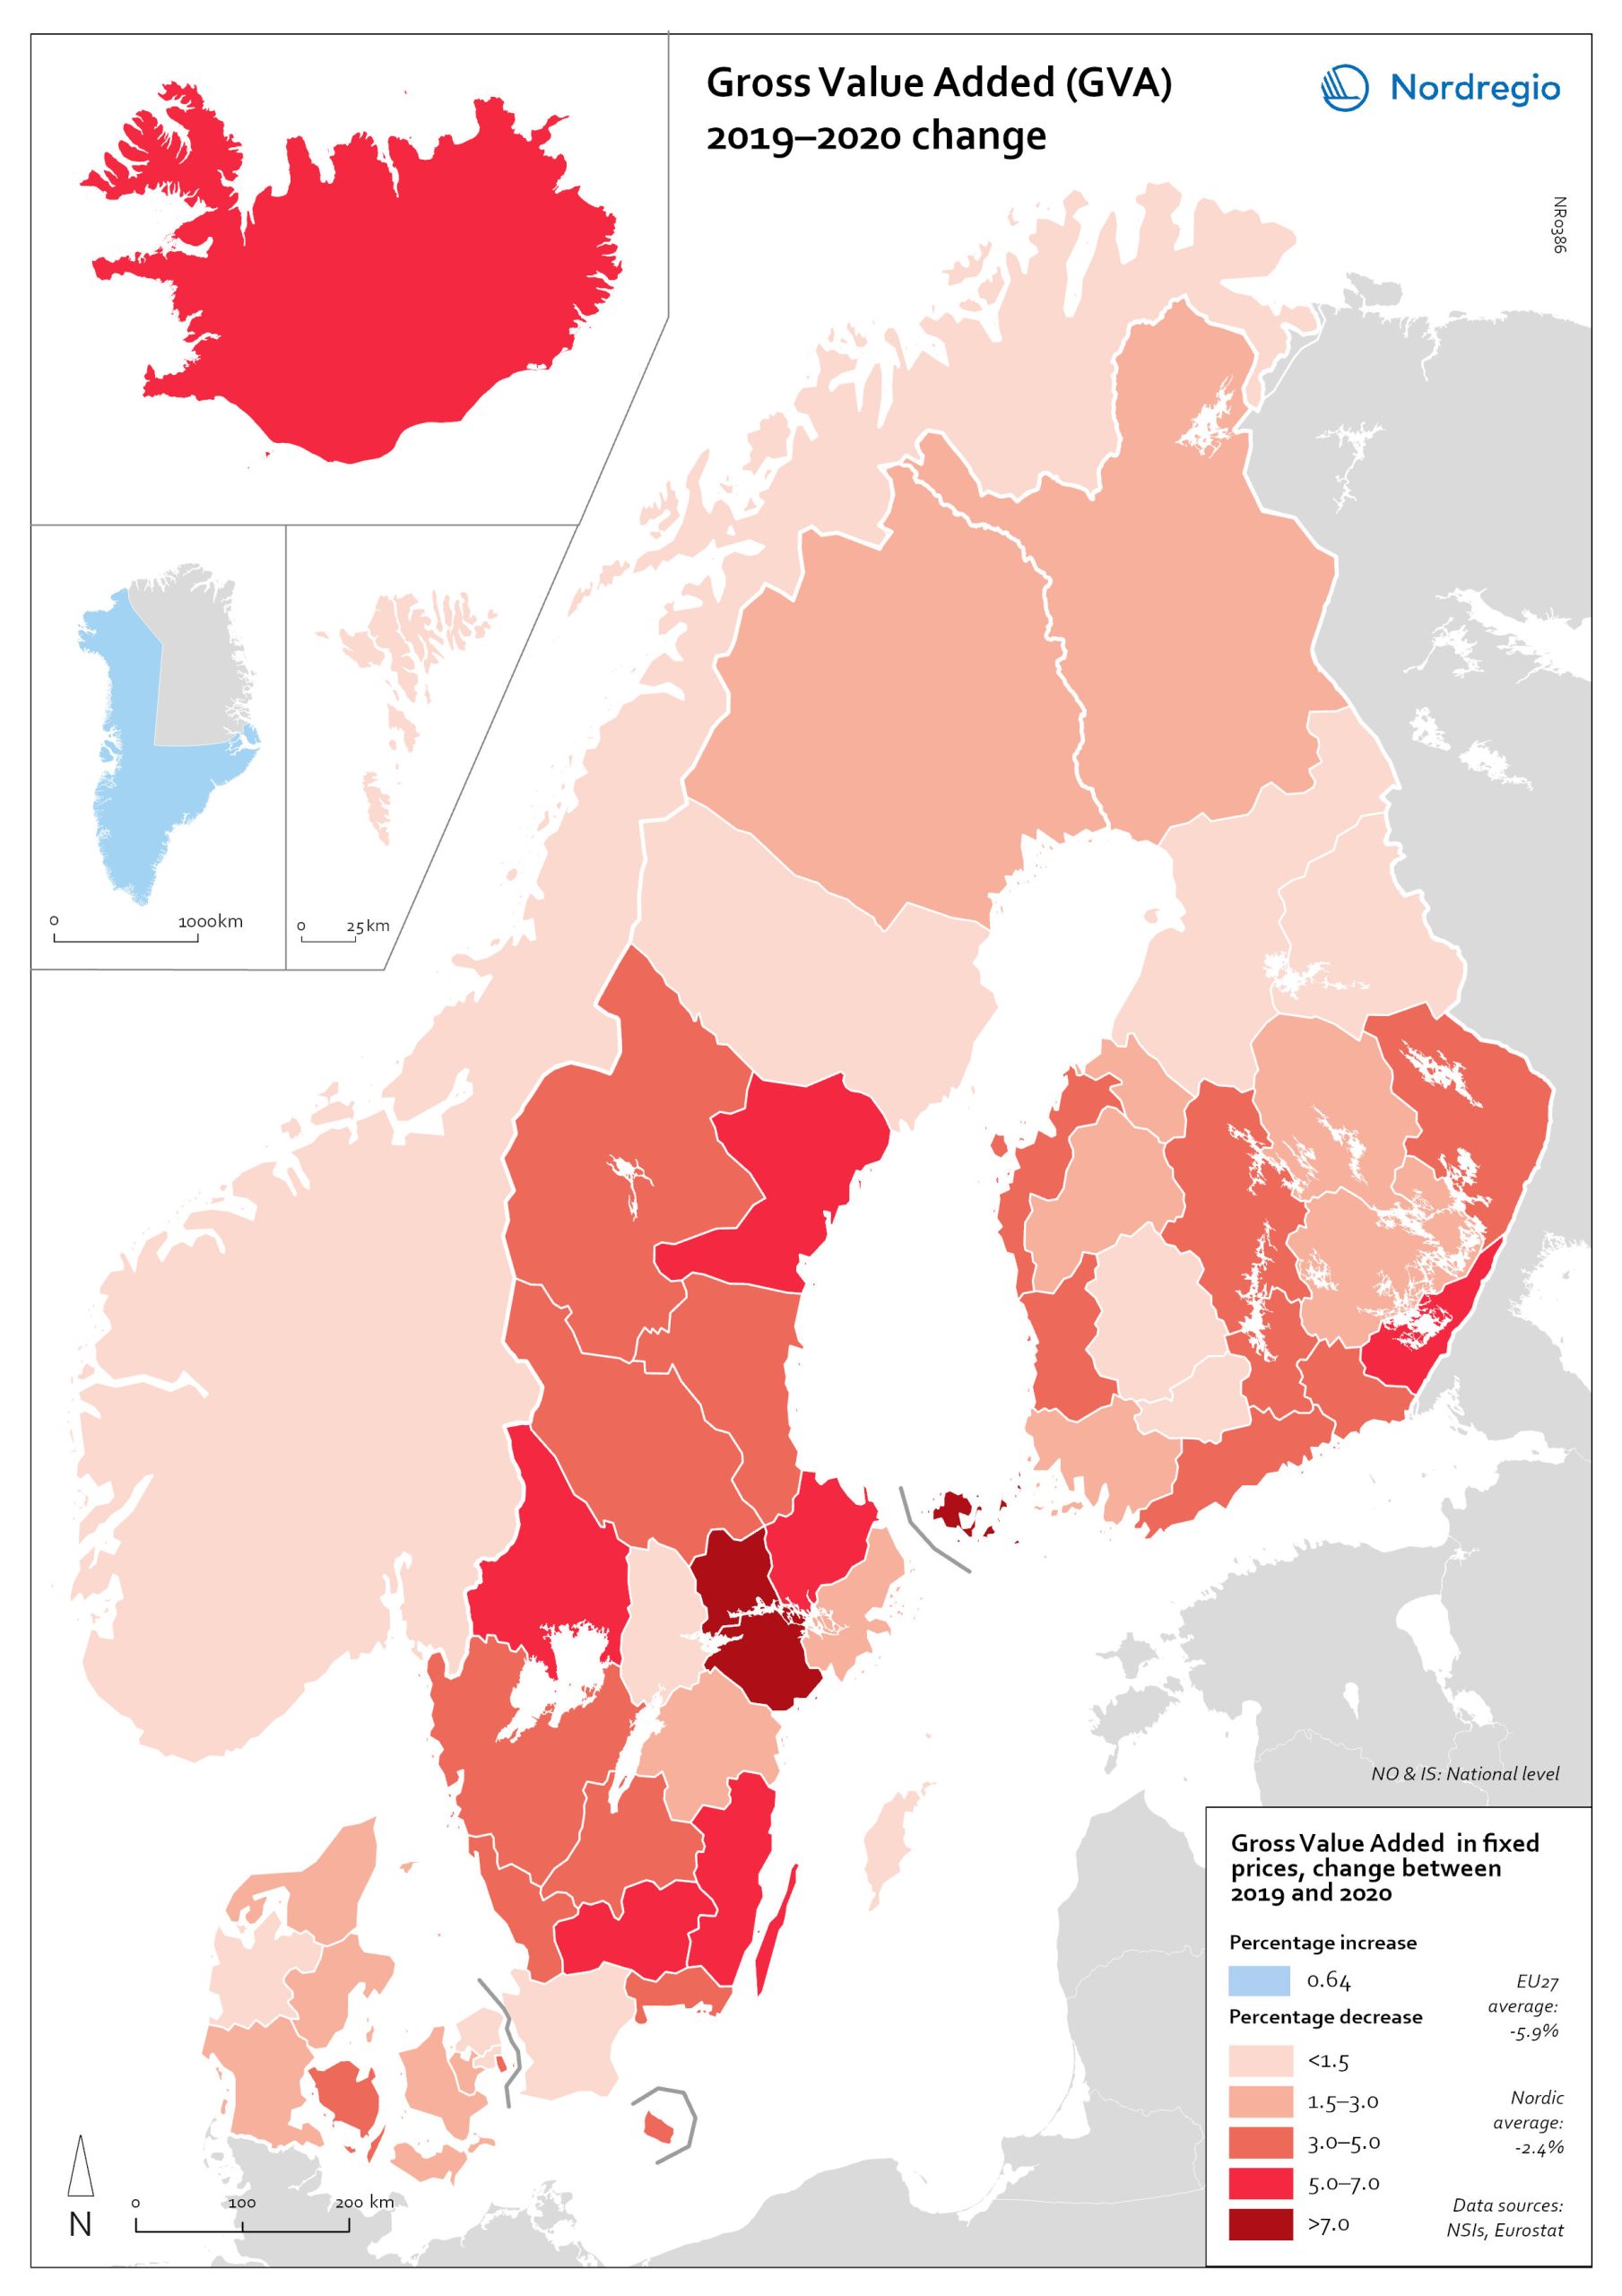
Gross Value Added (GVA) change 2019-2020
The map shows the change in regional Gross Value Added (GVA) from 2019 to 2020 (in fixed prices). As shown in the map, aggregated production levels, in terms of Gross Value Added (GVA), contracted in nearly all of the Nordic regions between 2019 and 2020. In general, the variability was comparatively smaller within each country than it was between countries, even when comparing regions with similar economic profiles from different countries. On average, the impact was greater on regions in Sweden and Finland than those in Denmark. Still, some relevant territorial patterns emerge from the changes to regional GVA shown in the map. The contraction was larger in regions with higher dependence on tourism services and hospitality (Åland and some municipalities in South Karelia, Finland, and Bornholm, Denmark), as well as on mass-market retail and logistics, particularly in the areas surrounding the capital regions (Södermanland and Västmanland in Sweden and Greater Copenhagen in Denmark). In Sweden and Finland, a remarkable regional divide can also be traced between territories specialised in transformation sectors with limited vulnerability to the impact of Covid-19, including forestry and specific types of processing (e.g. pulp, cement), like Nord Ostrobothnia, Kainuu and Pirkanmaa in Finland, and Gotland, Västerbotten and Örebro in Sweden. Aggregated output in these regions fell less than in regions with greater exposure to industrial manufacturing, like Kymenlaakso in Finland and Kronobergs in Sweden. Similarly, the impact on the financial centres in Denmark (Greater Copenhagen) and Sweden (Stockholm) was less than regions with mid-sized cities and diversified urban economies, like Vestjylland (Århus) in Denmark and Upsala in Sweden. Interestingly, the shock to the Finnish economy was greater in the Helsinki metropolitan area (-3.6% Uusimaa) than it was for the Tampere region (-0.5% in Pirkanmaa). This may be due to the relatively higher concentration…
2022 March
- Economy
- Nordic Region

Major immigration flows to the Nordic Region from 2010 to 2019
The map shows annual average immigration flows above 3,000 people, and the growing diversity in their countries of origin Sweden and Denmark, in particular, experienced large inflows from non-Nordic countries during the period 2010-2019, with Sweden standing out as the Nordic country with by far the largest immigrant in-flows. A large portion of these arrivals were from war-torn Syria (an annual average of almost 15,000), followed by Poland (approximately 4,500), United Kingdom, Iraq, India and Iran (around 4,000 each). Denmark experienced a smaller number of inflows above 3,000 people, compared to Sweden. The largest non-Nordic inflows to Denmark were around 5,000 people (per sending country) and included migrants from the U.S., Germany, Romania and Poland. For Norway, large non-Nordic in-flows were limited to Lithuania and Poland. Similarly, Finland had only one major inflow, from Estonia.
2021 December
- Migration
- Nordic Region
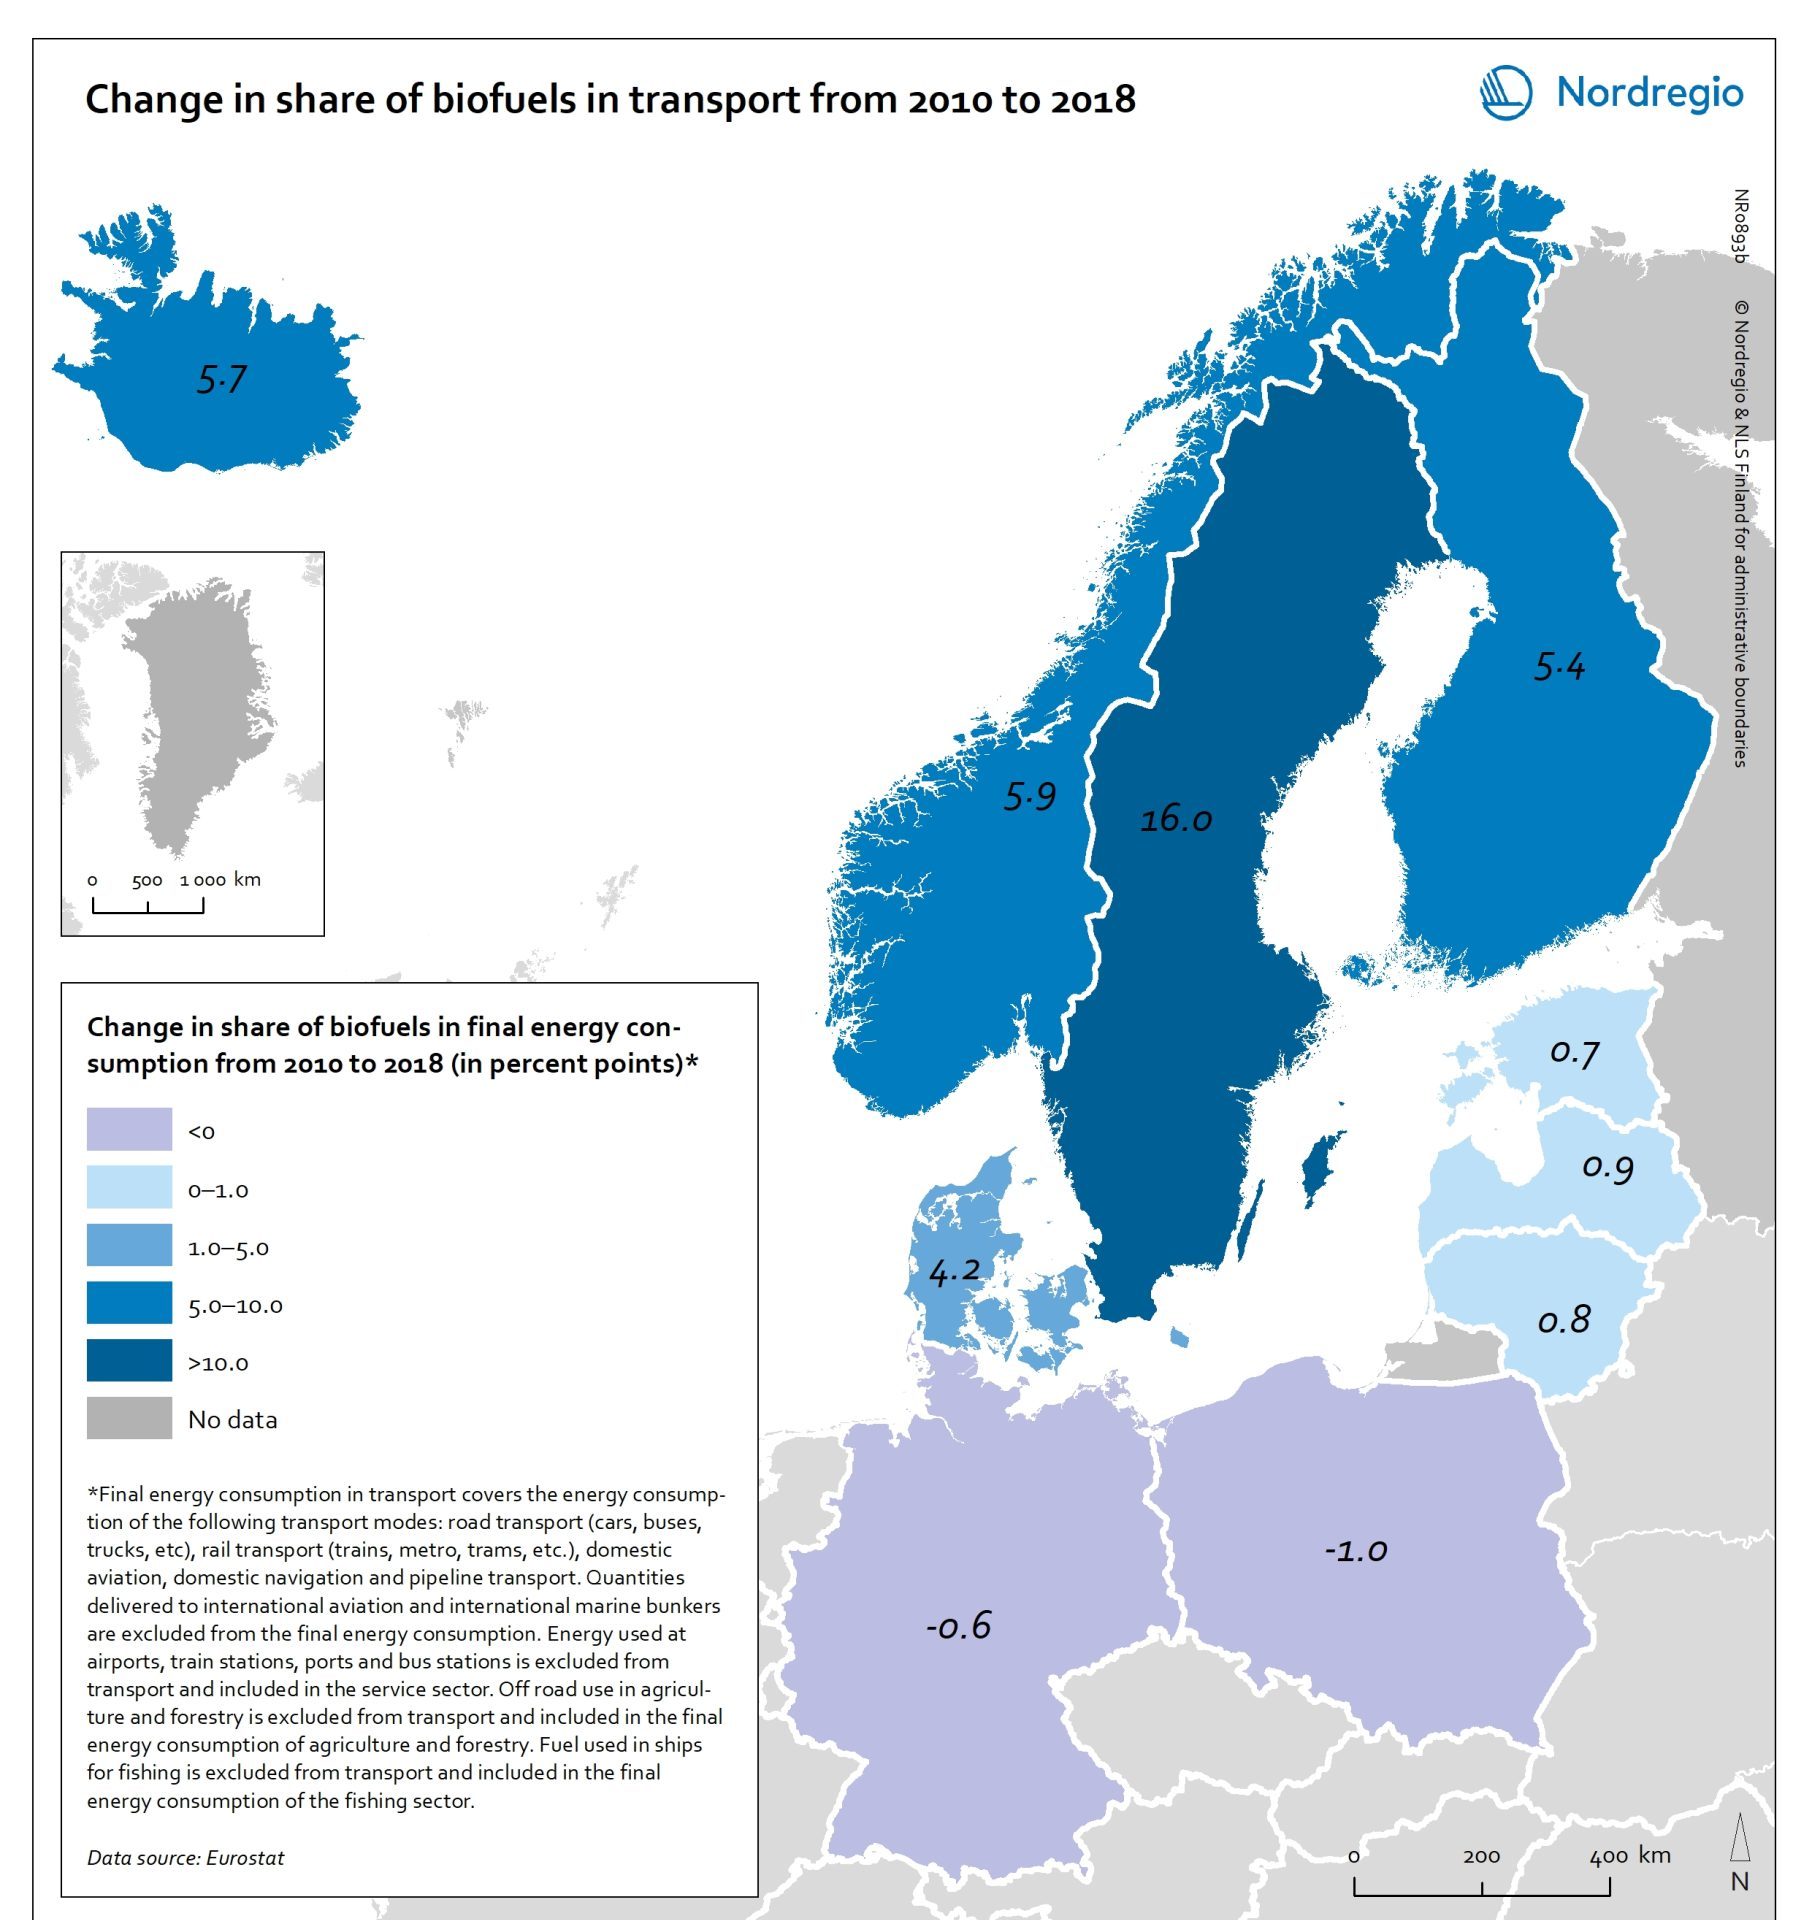
Change in share of biofuels in transport from 2010 to 2018
This map shows change in share of biofuels in final energy consumption in transport in the Nordic Arctic and Baltic Sea Region from 2010 to 2018. Even though a target for greater use of biofuels has been EU policy since the Renewable Energy and Fuel Quality Directives of 2009, development has been slow. The darker shades of blue on the map represent higher increase, and the lighter shades of blue reflect lower increase. The lilac color represent decrease. The Baltic Sea represents a divide in the region, with countries to the north and west experiencing growth in the use of biofuels for transport in recent years. Sweden stands out (16 per cent growth), while the other Nordic countries has experienced more modest increase. In the southern and eastern parts of the region, the use of biofuels for transport has largely stagnated. Total biofuel consumption for transport has risen more than the figure indicates due to an increase in transport use over the period.
2021 December
- Arctic
- Baltic Sea Region
- Nordic Region
- Transport
Tourism gross value added as a share of GVA 2018
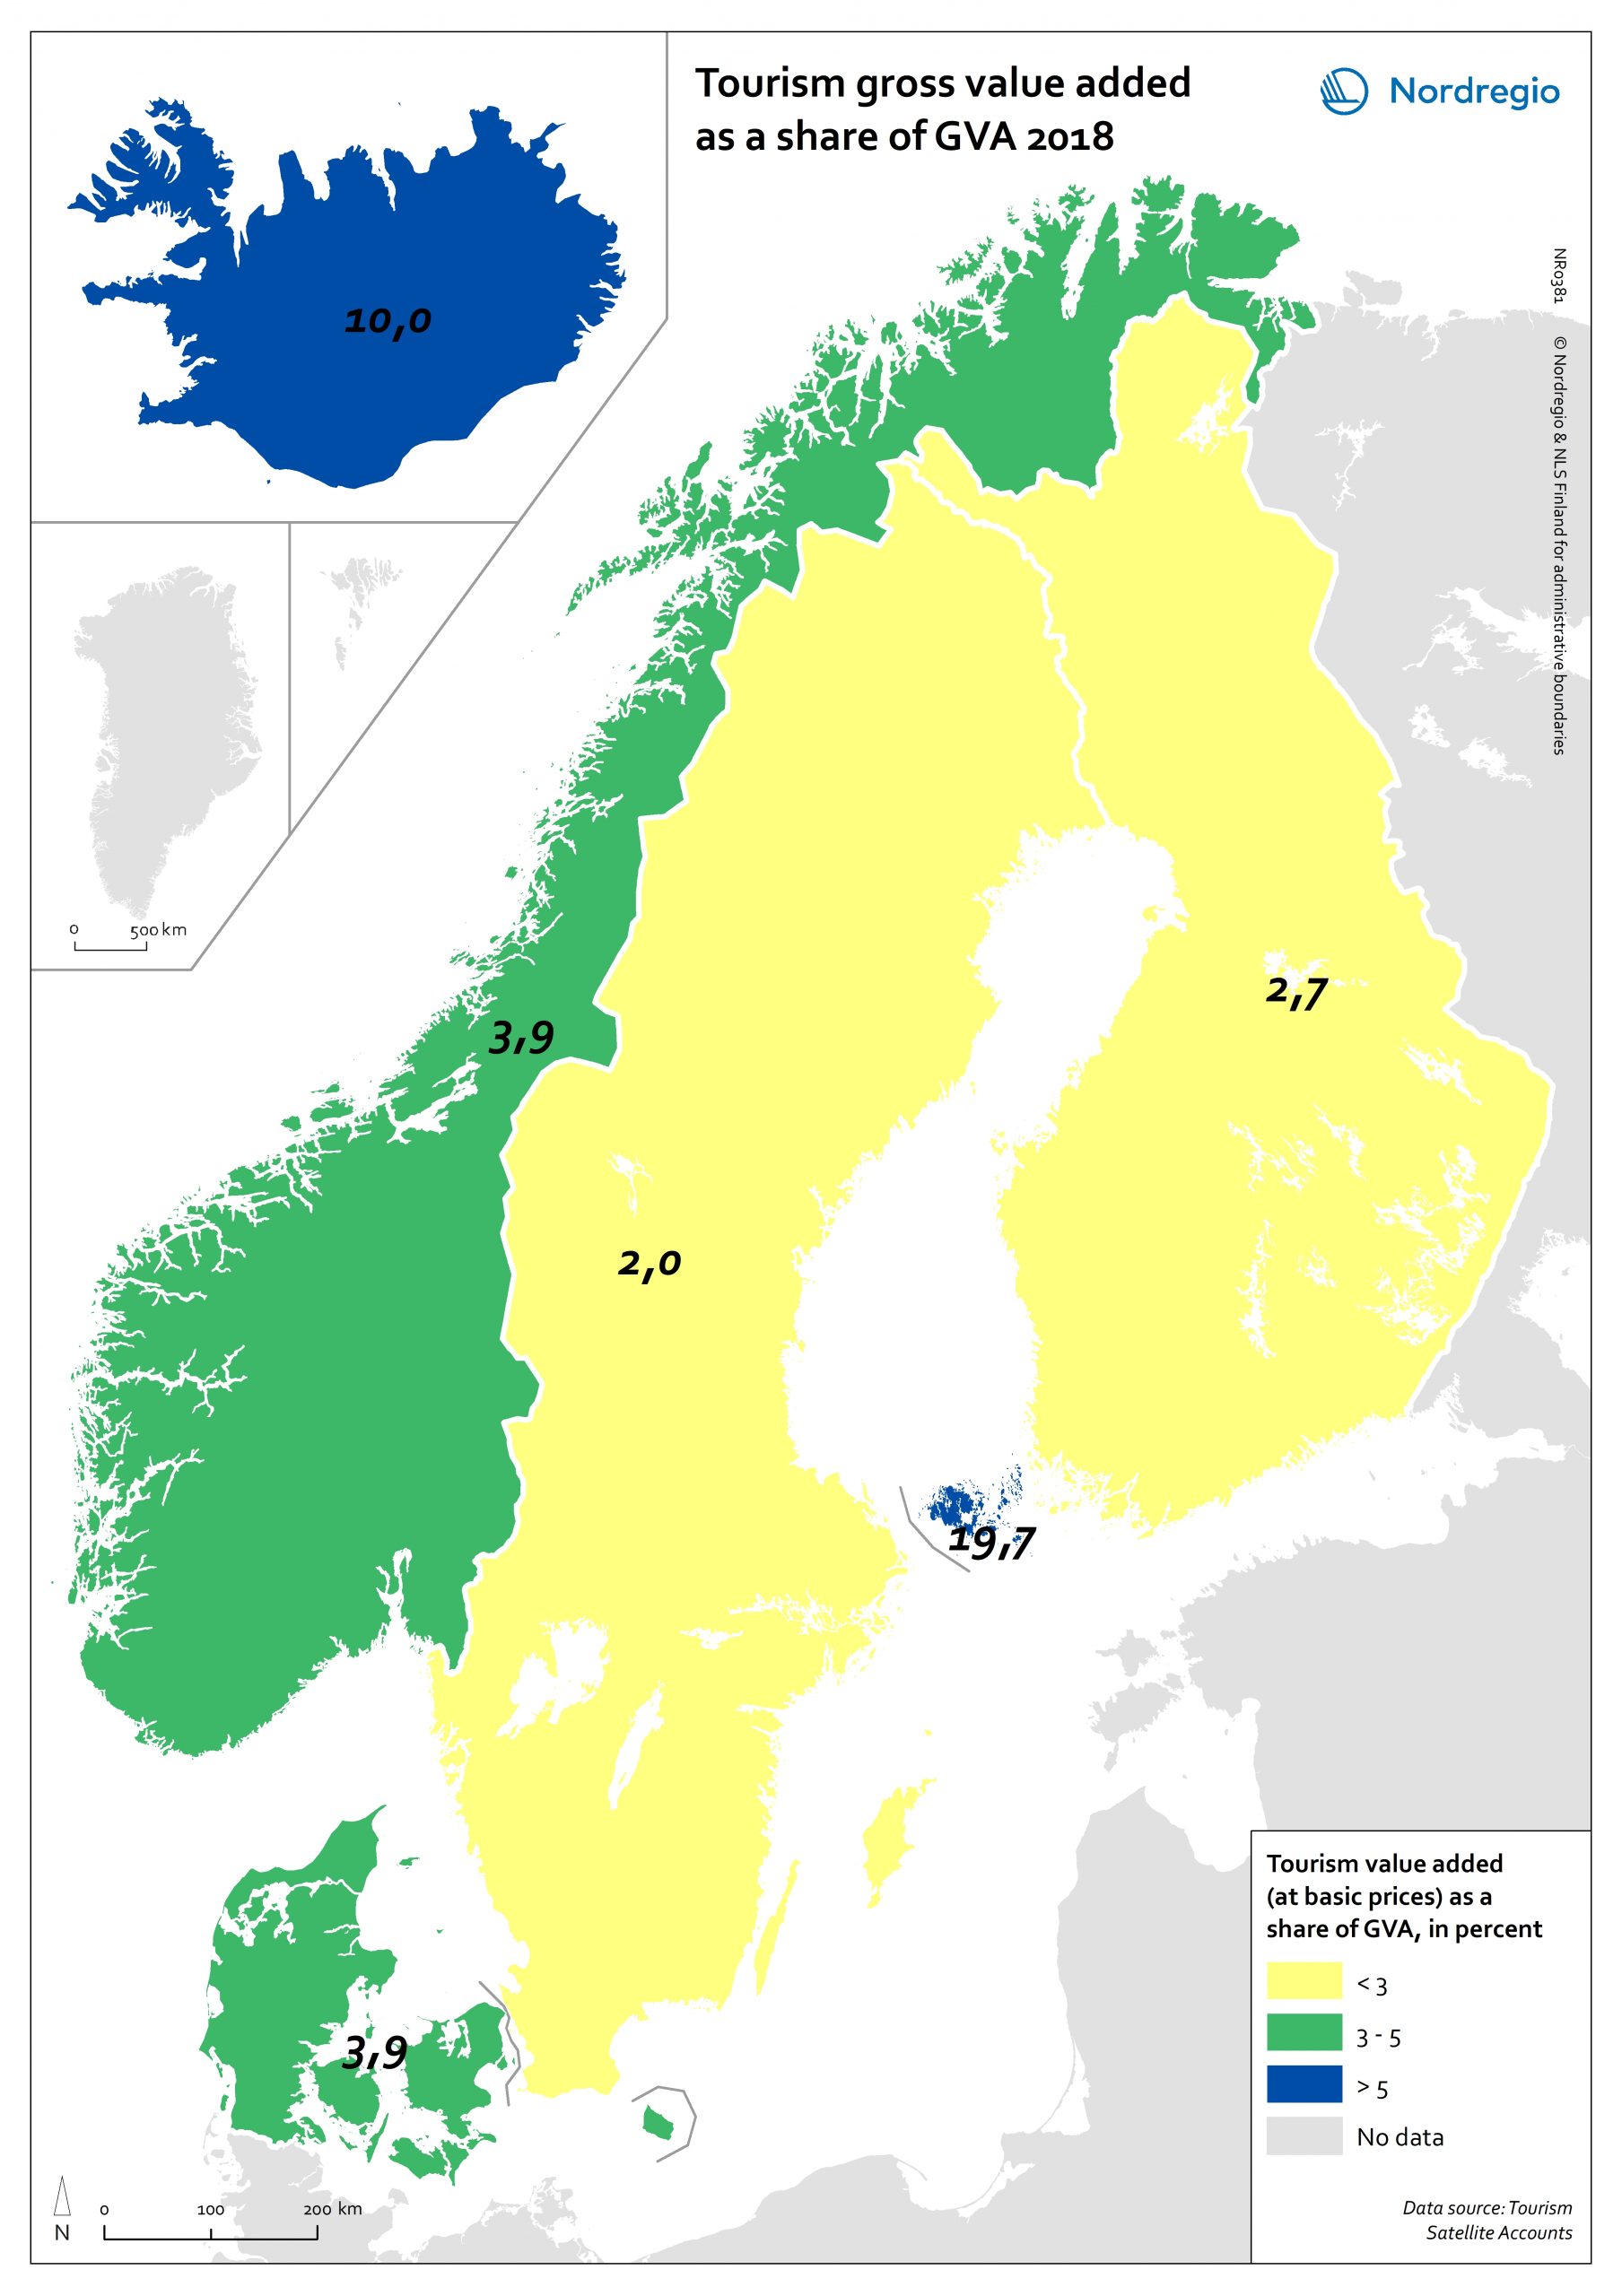
Tourism gross added value (GVA) corresponds to the part of GVA generated by all industries in contact with visitors. This indicator is measured as a percentage of total GVA at basic prices in 2018 (No data for Greenland and Faroe Islands; data for Finland includes Åland). Data were retrieved from each country’s tourism satellite account. Åland and Iceland stand out as the country or territory where tourism added value accounts for over 10% of the total GVA. For Åland, tourism is so important an industry that added value related to tourism is equivalent to nearly 20% of the total GVA in Åland. The share of tourism related GVA is close to 4% of the total GVA in Norway and Denmark, and lower than 3% in Finland and Sweden.
2021 February
- Economy
- Nordic Region


