2 News

A 3D population map for the holiday season
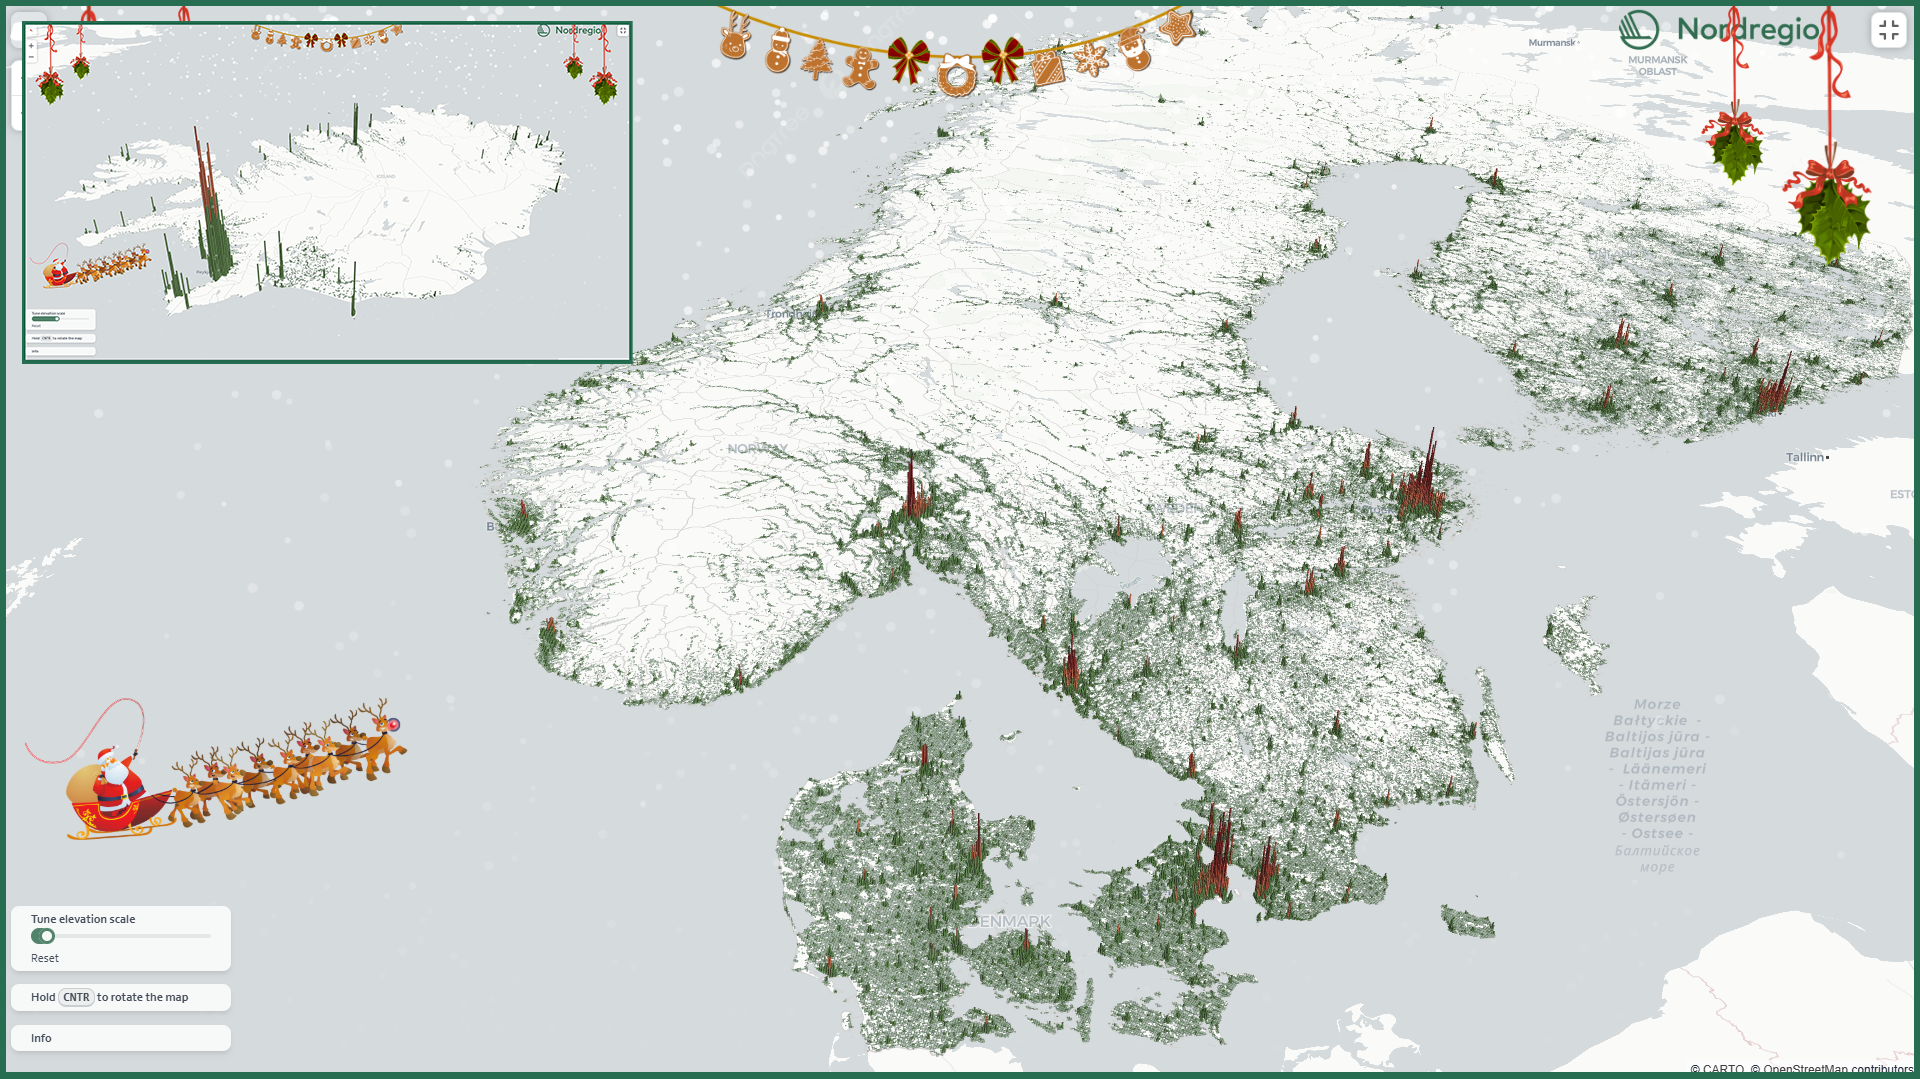
This Christmas, we’re gifting all fellow data nerds our first-ever interactive 3D map! The map displays the number of residents in each 1km grid cell, with the height of the bars representing the number of residents in each area.
2024 December
- Demography
- Nordic Region

Voting turnout in national elections
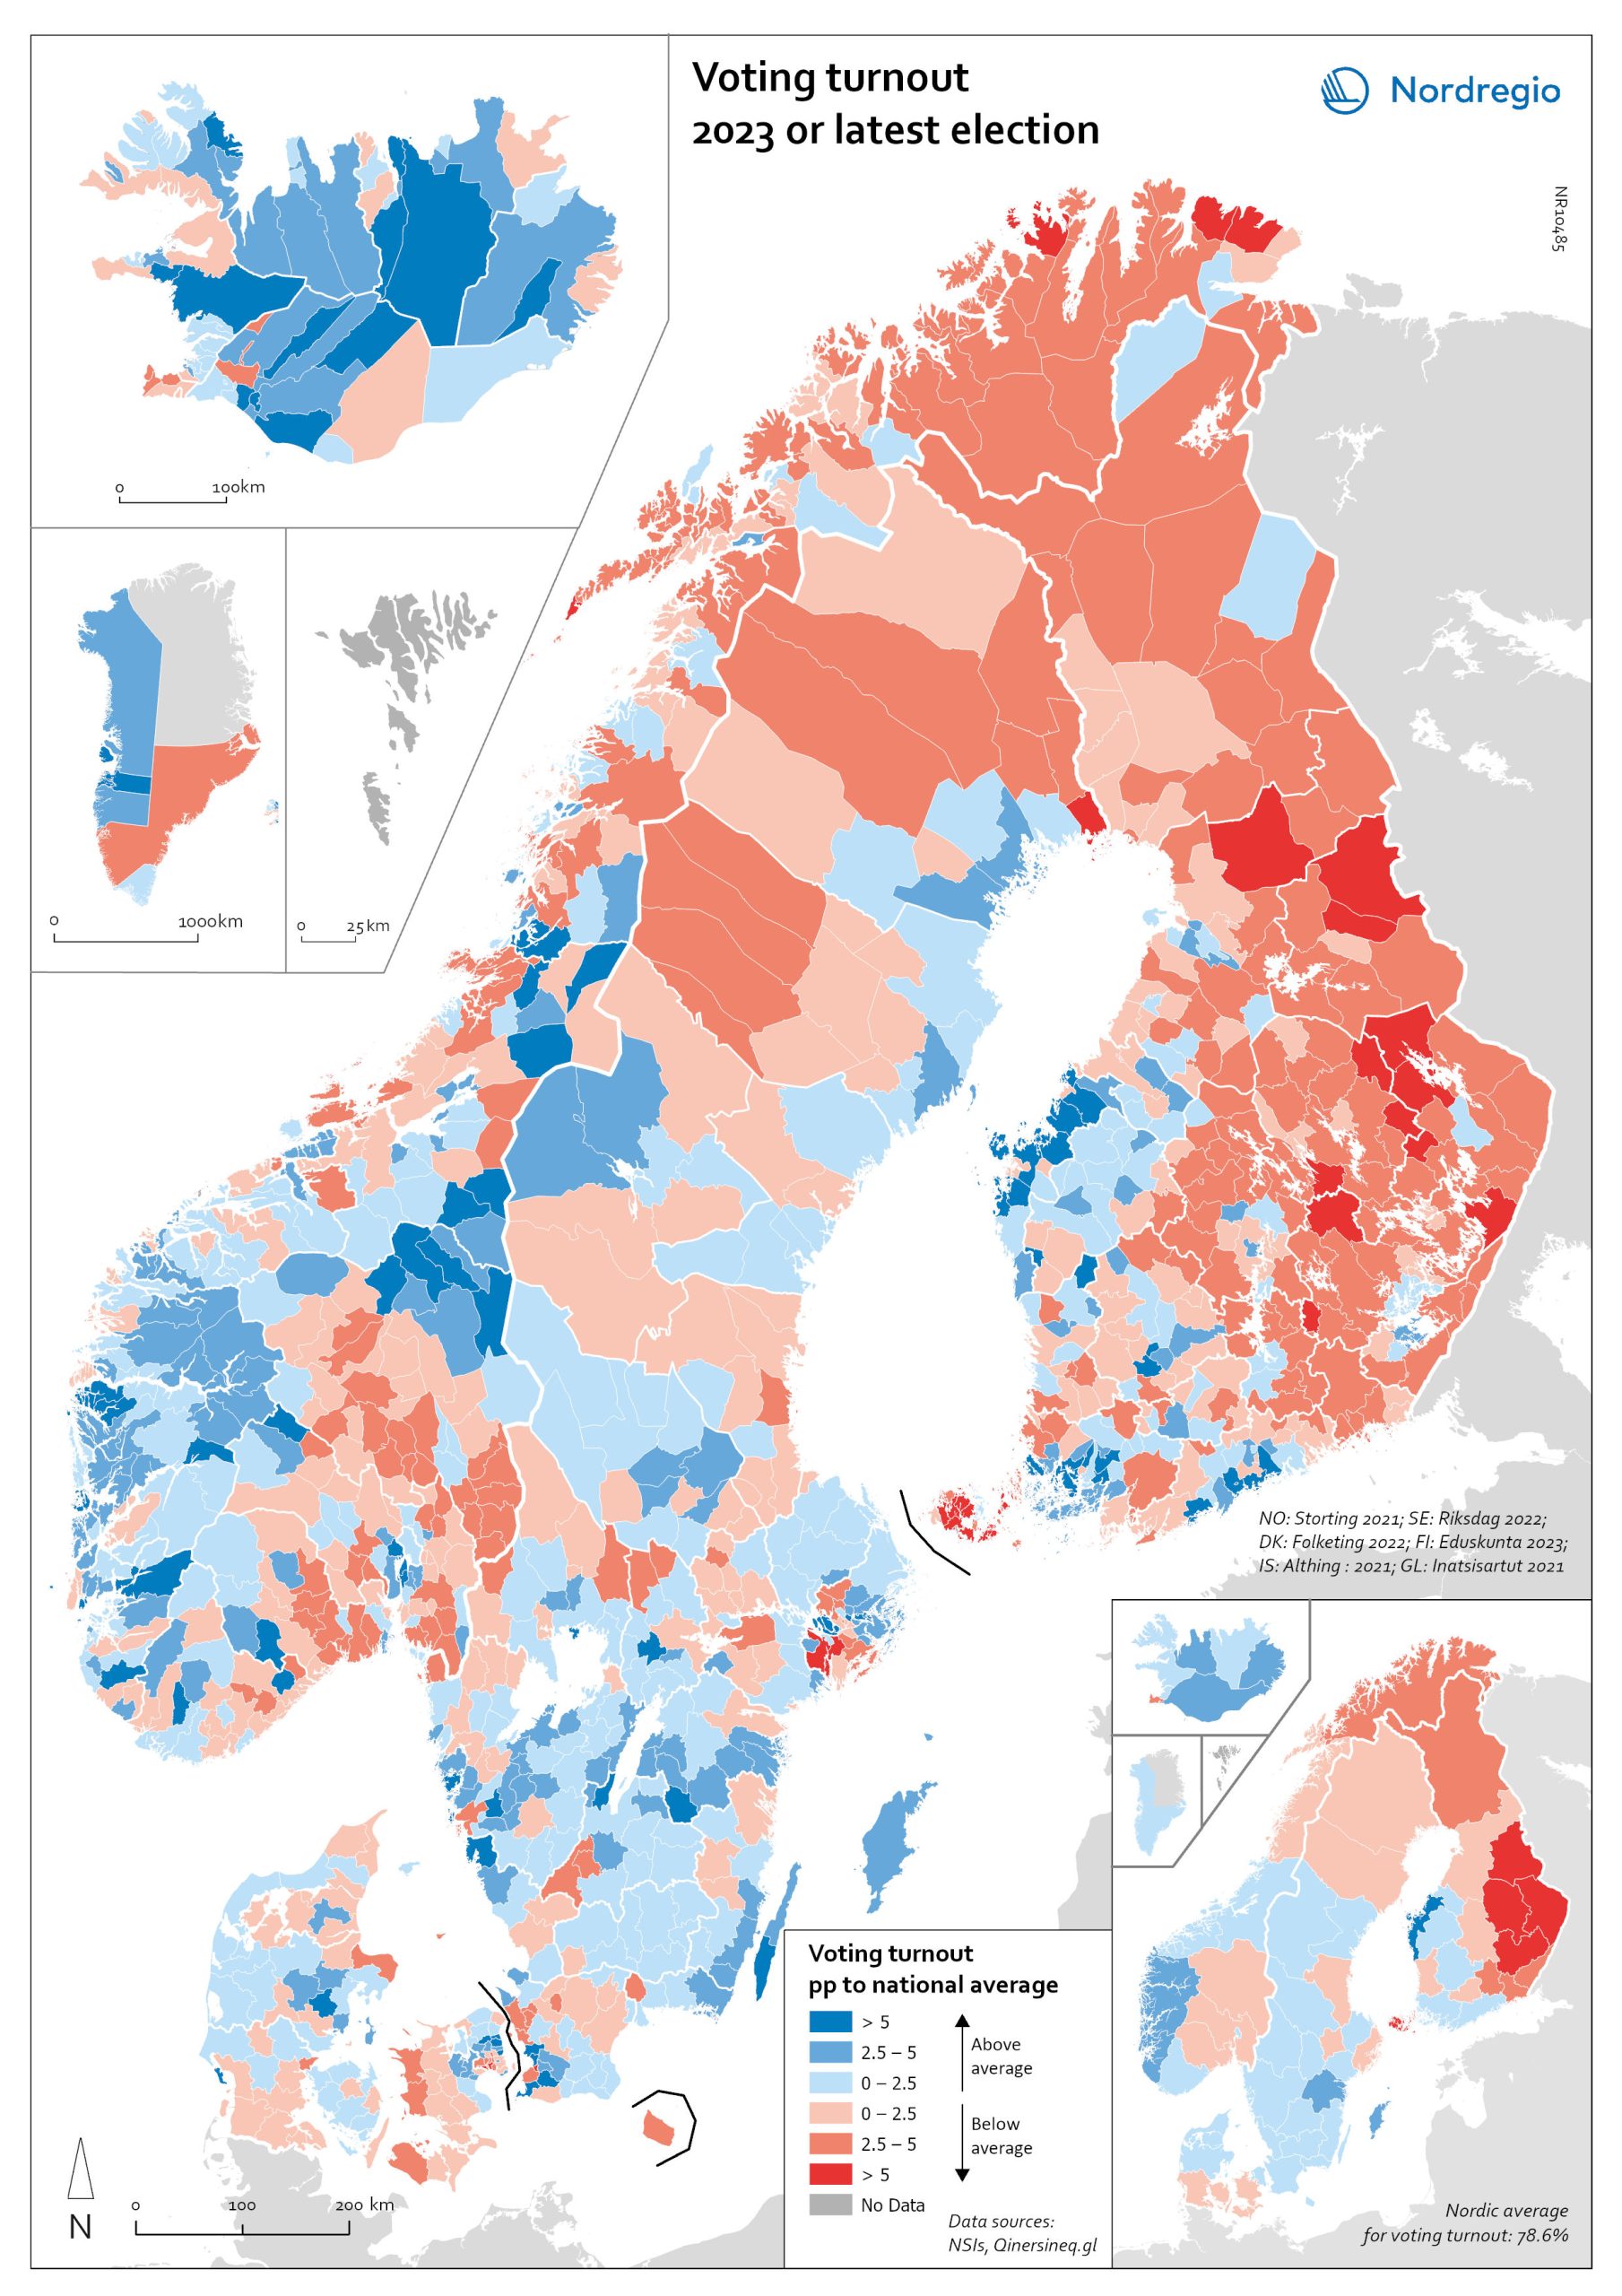
Voting turnout in 2023 (or latest national election). The map illustrates voter turnout as a percentage point relative to national averages, highlighting differences in participation levels between countries. This method removes inter-country differences in participation levels, providing a clearer view of the urban-rural divide. Lower turnout is observed in eastern Finland, northern Sweden, and the more rural parts of Denmark. In Norway, the lowest turnout occurs in the north and in municipalities outside Oslo. Nationally, the highest voter turnouts are in the Faroe Islands (88%), Sweden (84.2%), and Denmark (84.16%). Lower participation rates are found in Iceland (80.1%), Norway (77.2%), Finland (68.5%), and Greenland (65.9%).
2024 May
- Nordic Region
- Others

