12 Maps
Voting turnout in national elections
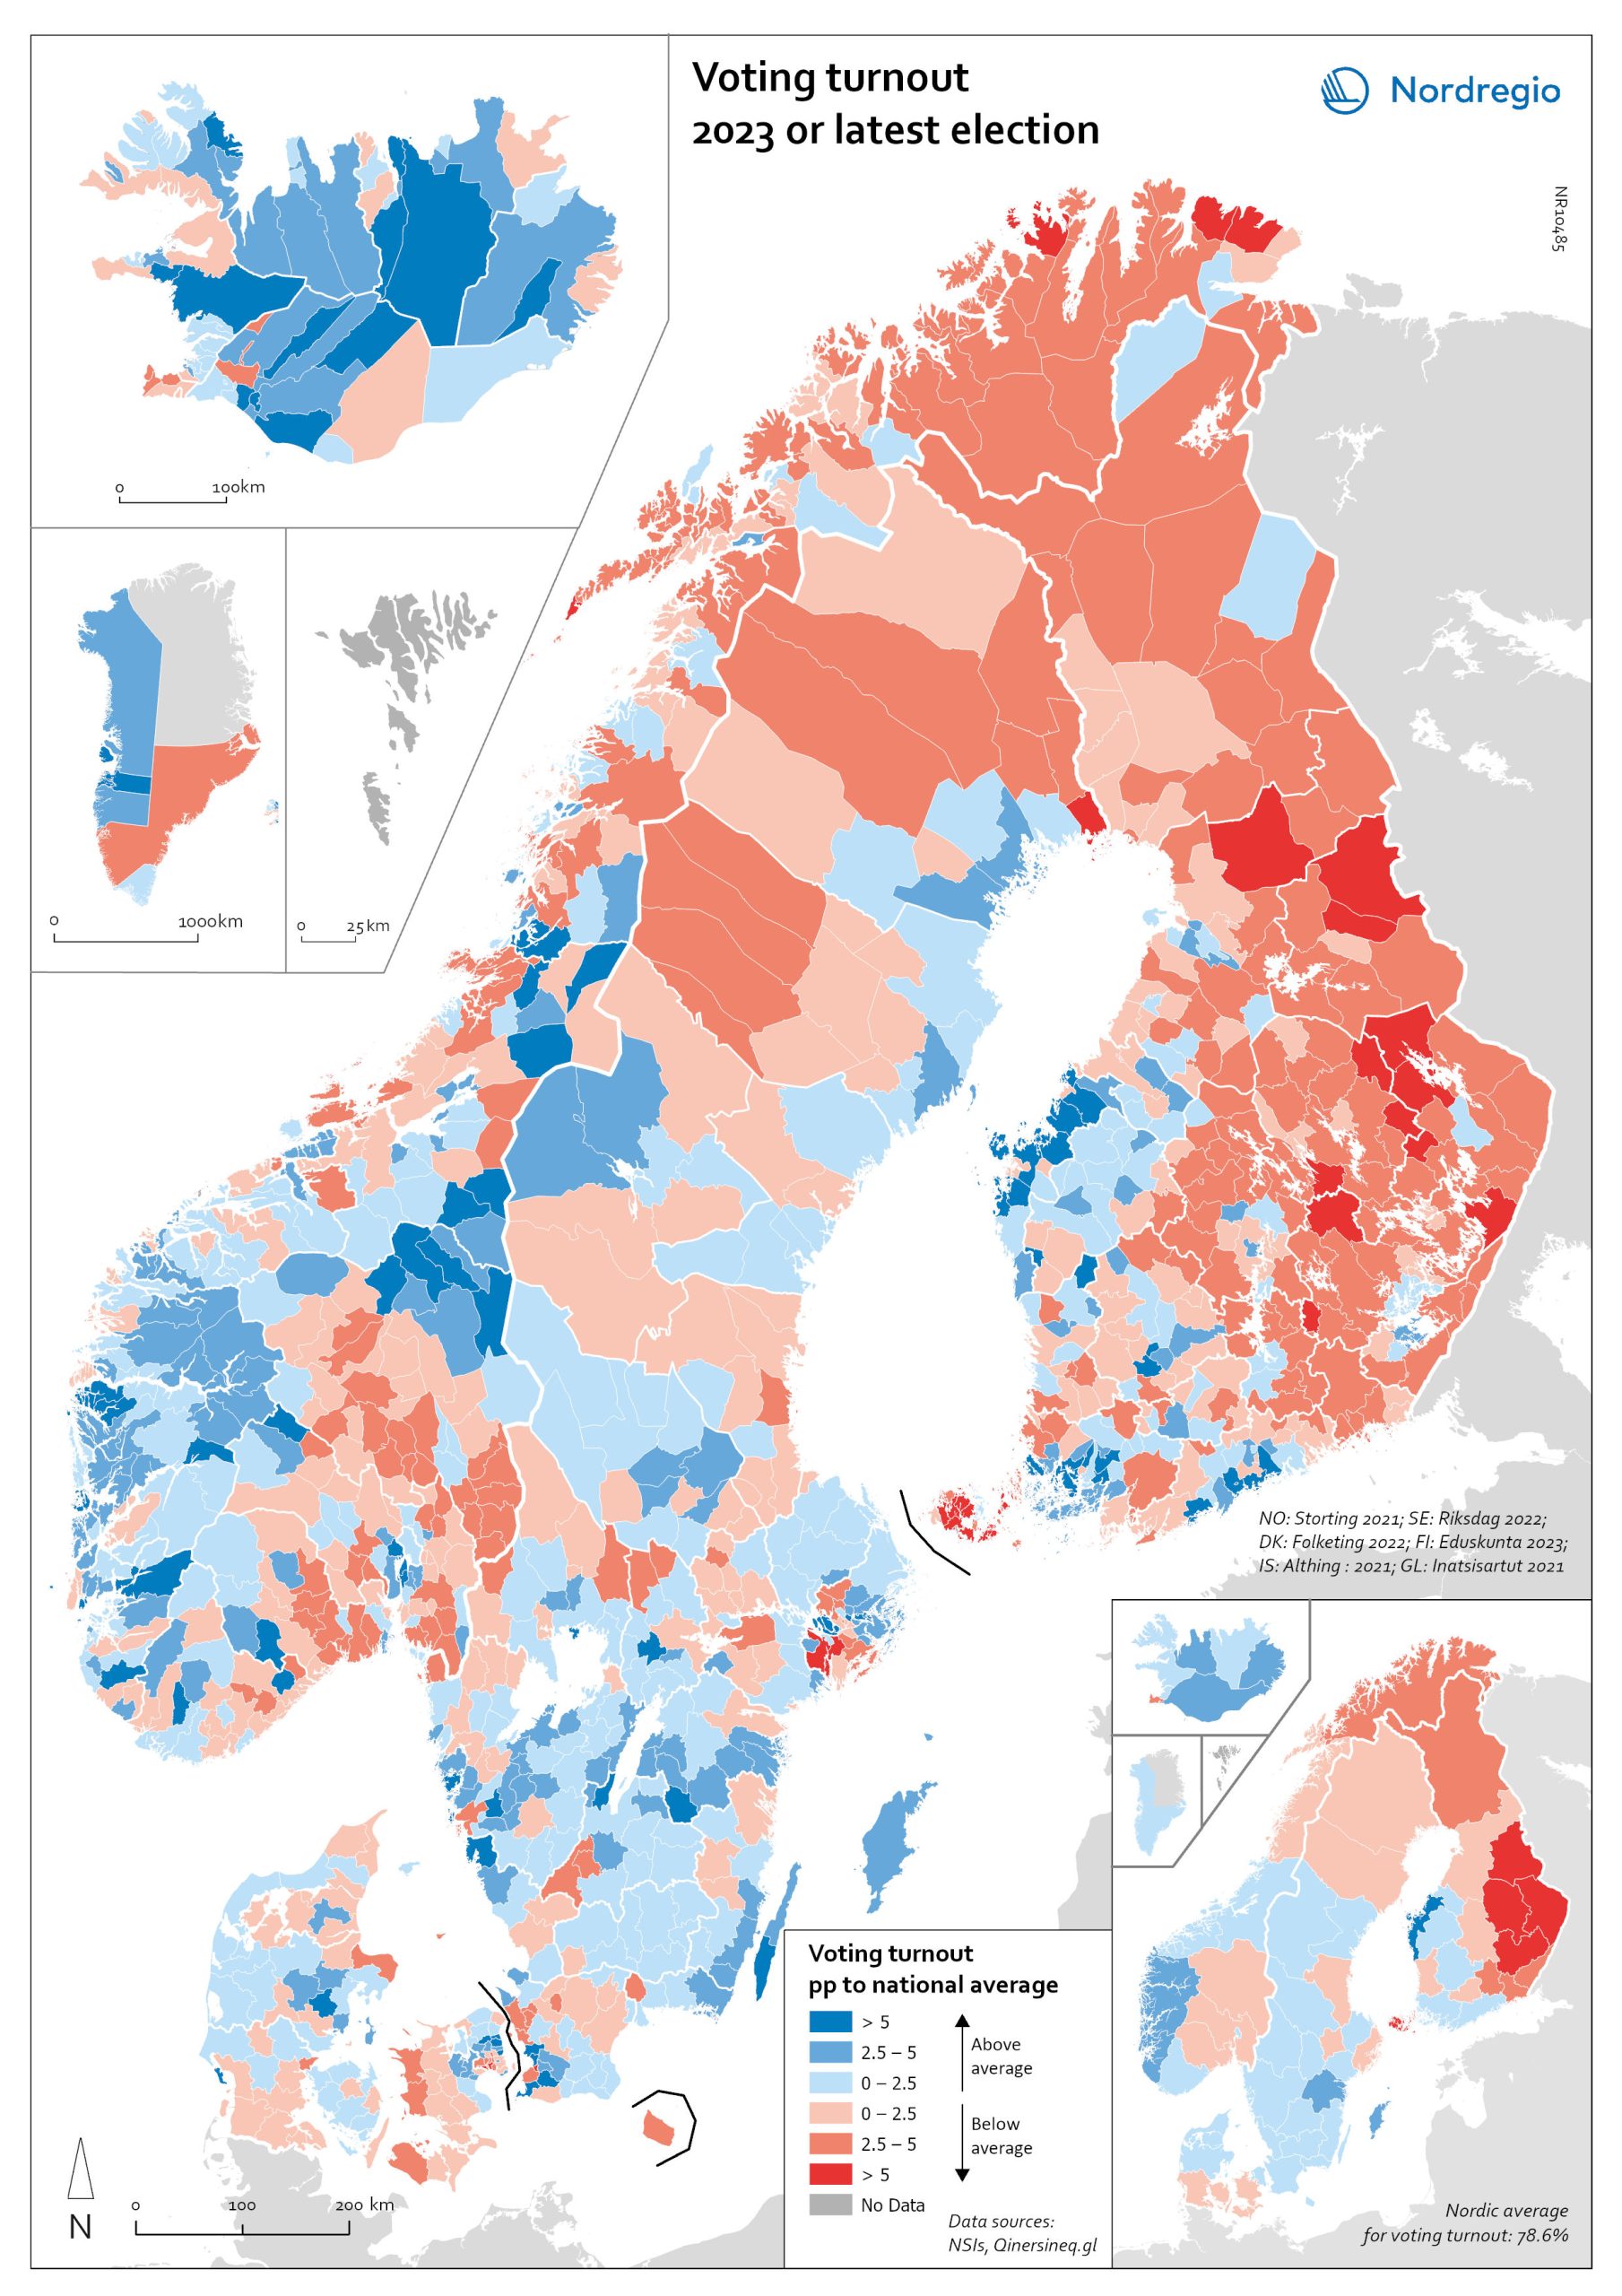
Voting turnout in 2023 (or latest national election). The map illustrates voter turnout as a percentage point relative to national averages, highlighting differences in participation levels between countries. This method removes inter-country differences in participation levels, providing a clearer view of the urban-rural divide. Lower turnout is observed in eastern Finland, northern Sweden, and the more rural parts of Denmark. In Norway, the lowest turnout occurs in the north and in municipalities outside Oslo. Nationally, the highest voter turnouts are in the Faroe Islands (88%), Sweden (84.2%), and Denmark (84.16%). Lower participation rates are found in Iceland (80.1%), Norway (77.2%), Finland (68.5%), and Greenland (65.9%).
2024 May
- Nordic Region
- Others
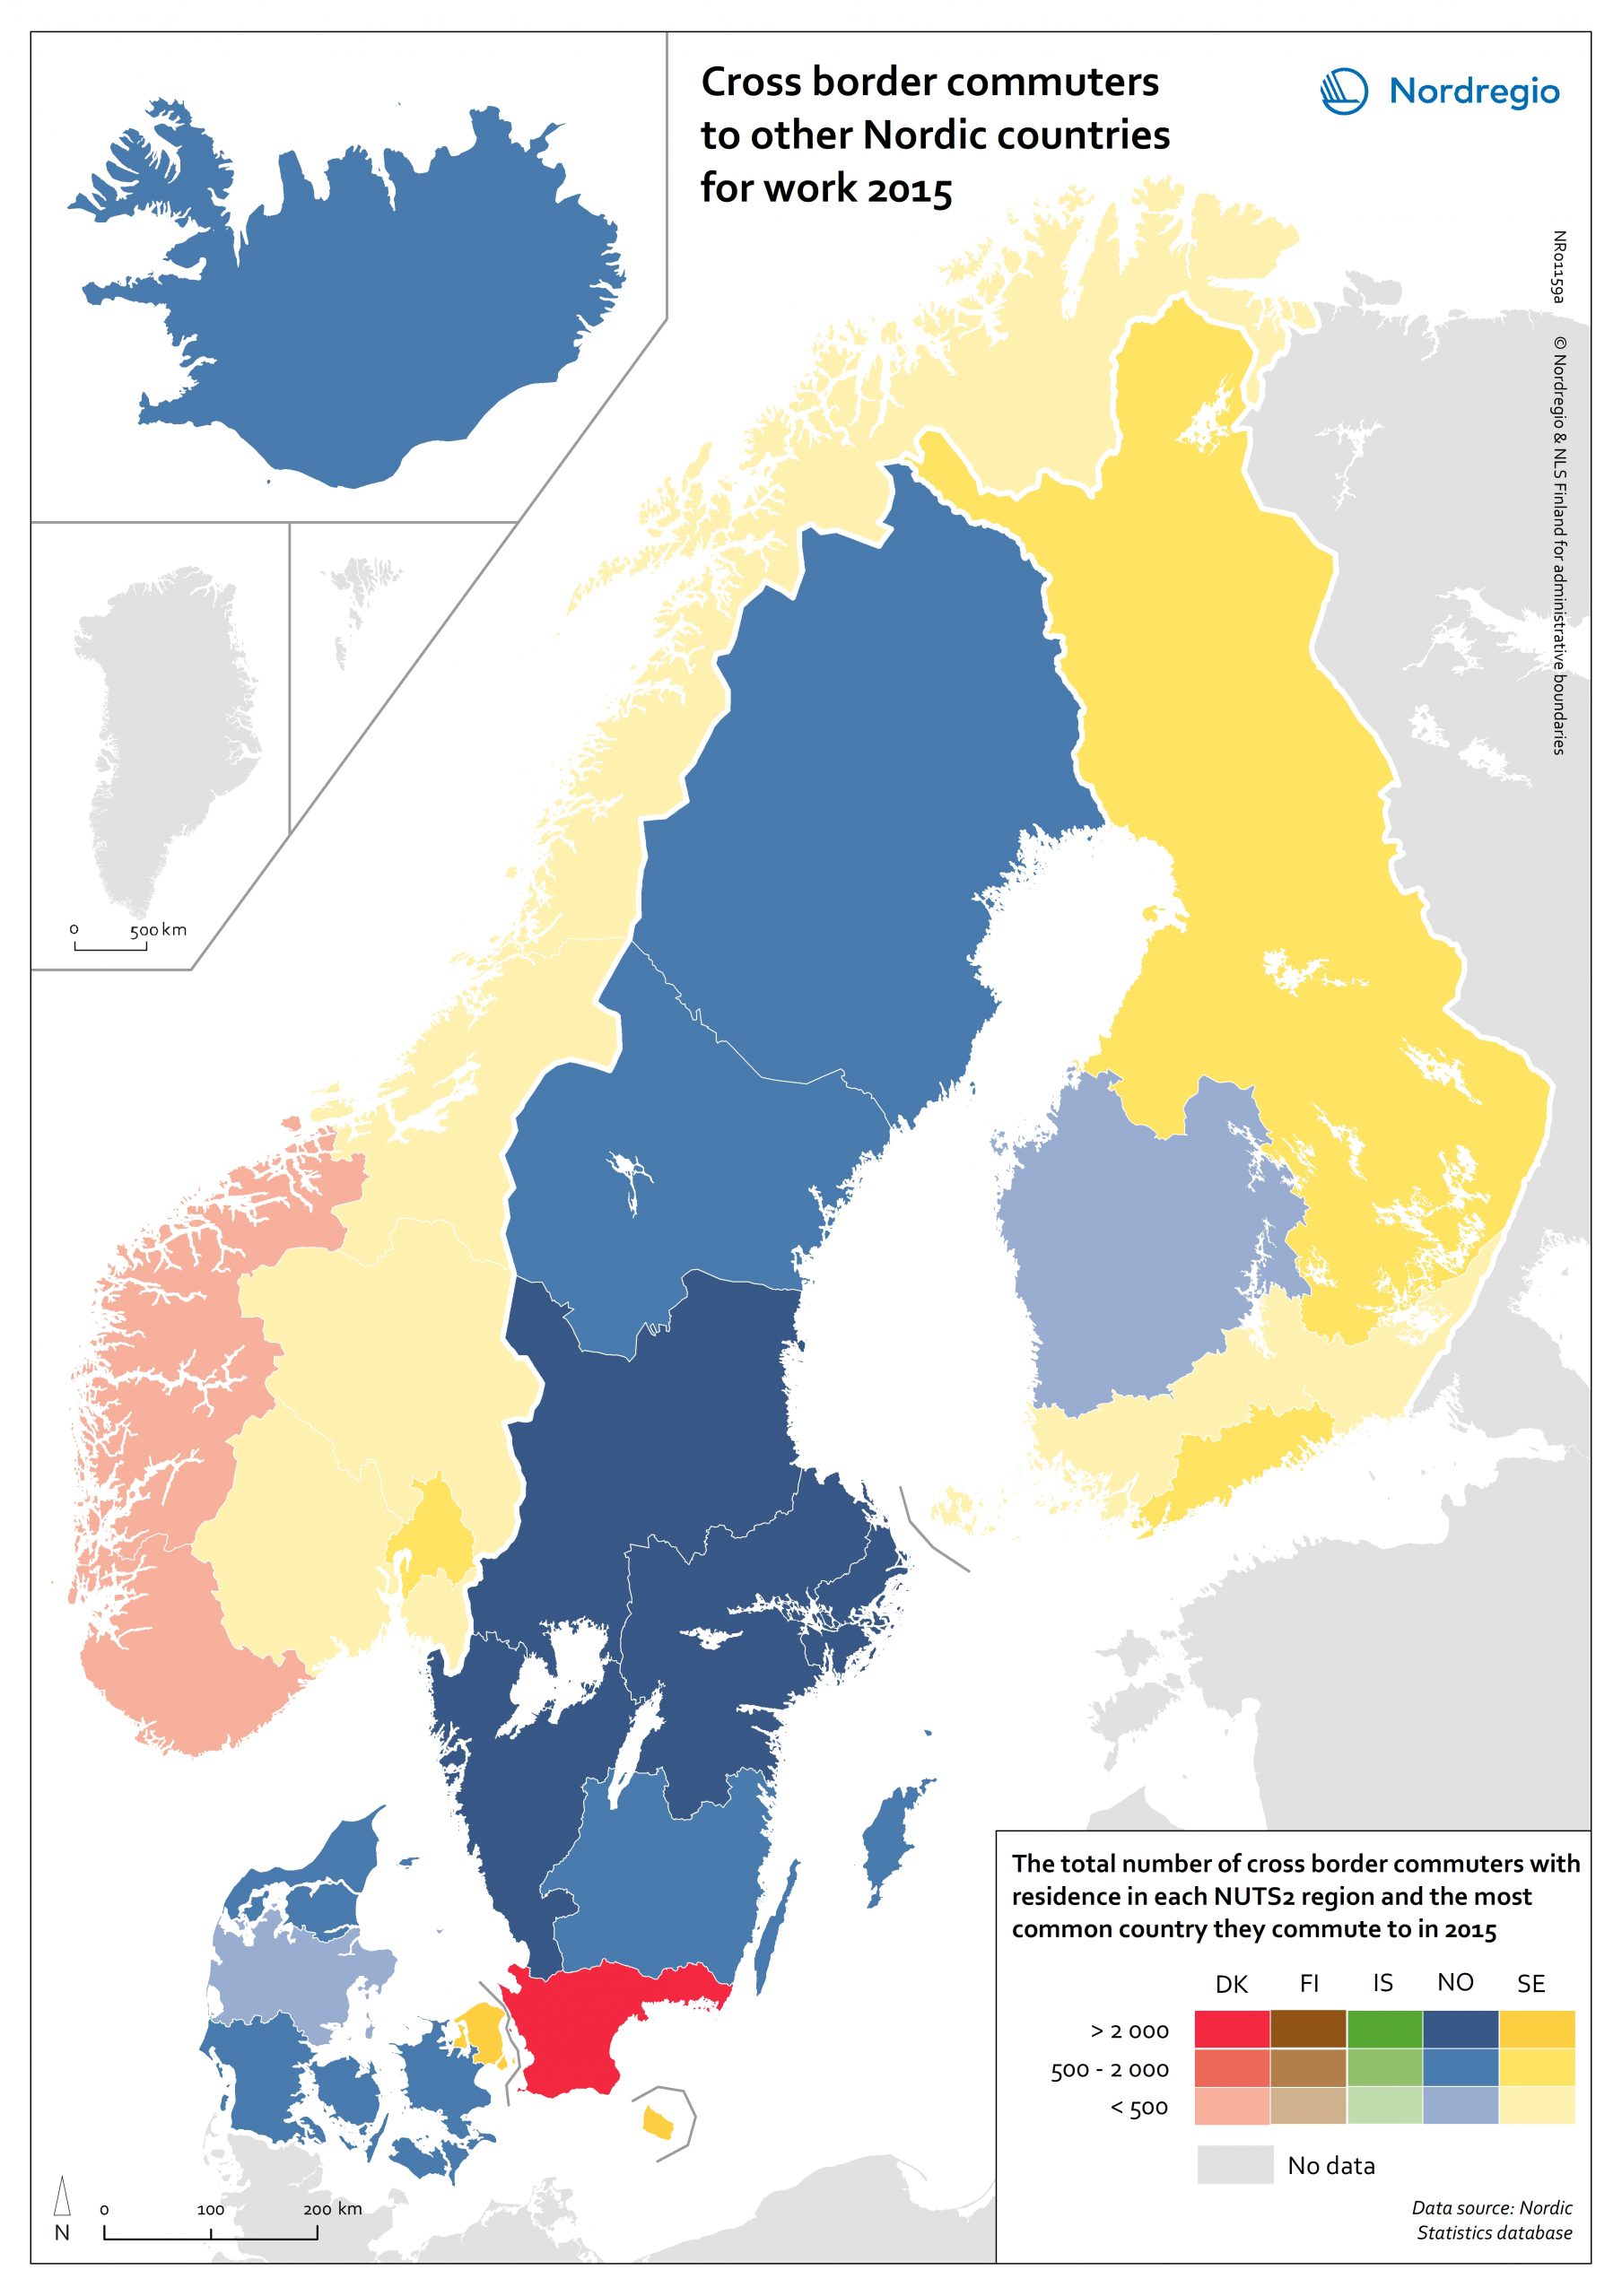



Major immigration flows to Finland 2010-2016
Average annual flows above 1000 people by country of origin Migration flows by country of origin are of growing interest in the Nordic Region due to the recent unprecedented inflows of migrants. There are also interesting differences between the Nordic countries with respect to the dominant countries of origin of migrants and the size of inflows. Finland had only four inflows exceeding annual averages of 1000 people during the measured period. The inflow from Estonia was by far the largest, an annual average of around 5000 people, flowed by inflows from Sweden and Russia (just under 3000), and the United Kingdom (around 1000).
2017 June
- Demography
- Finland
- Migration
- Nordic Region
- Other

