13 Maps

Gone missing: Nordic people!
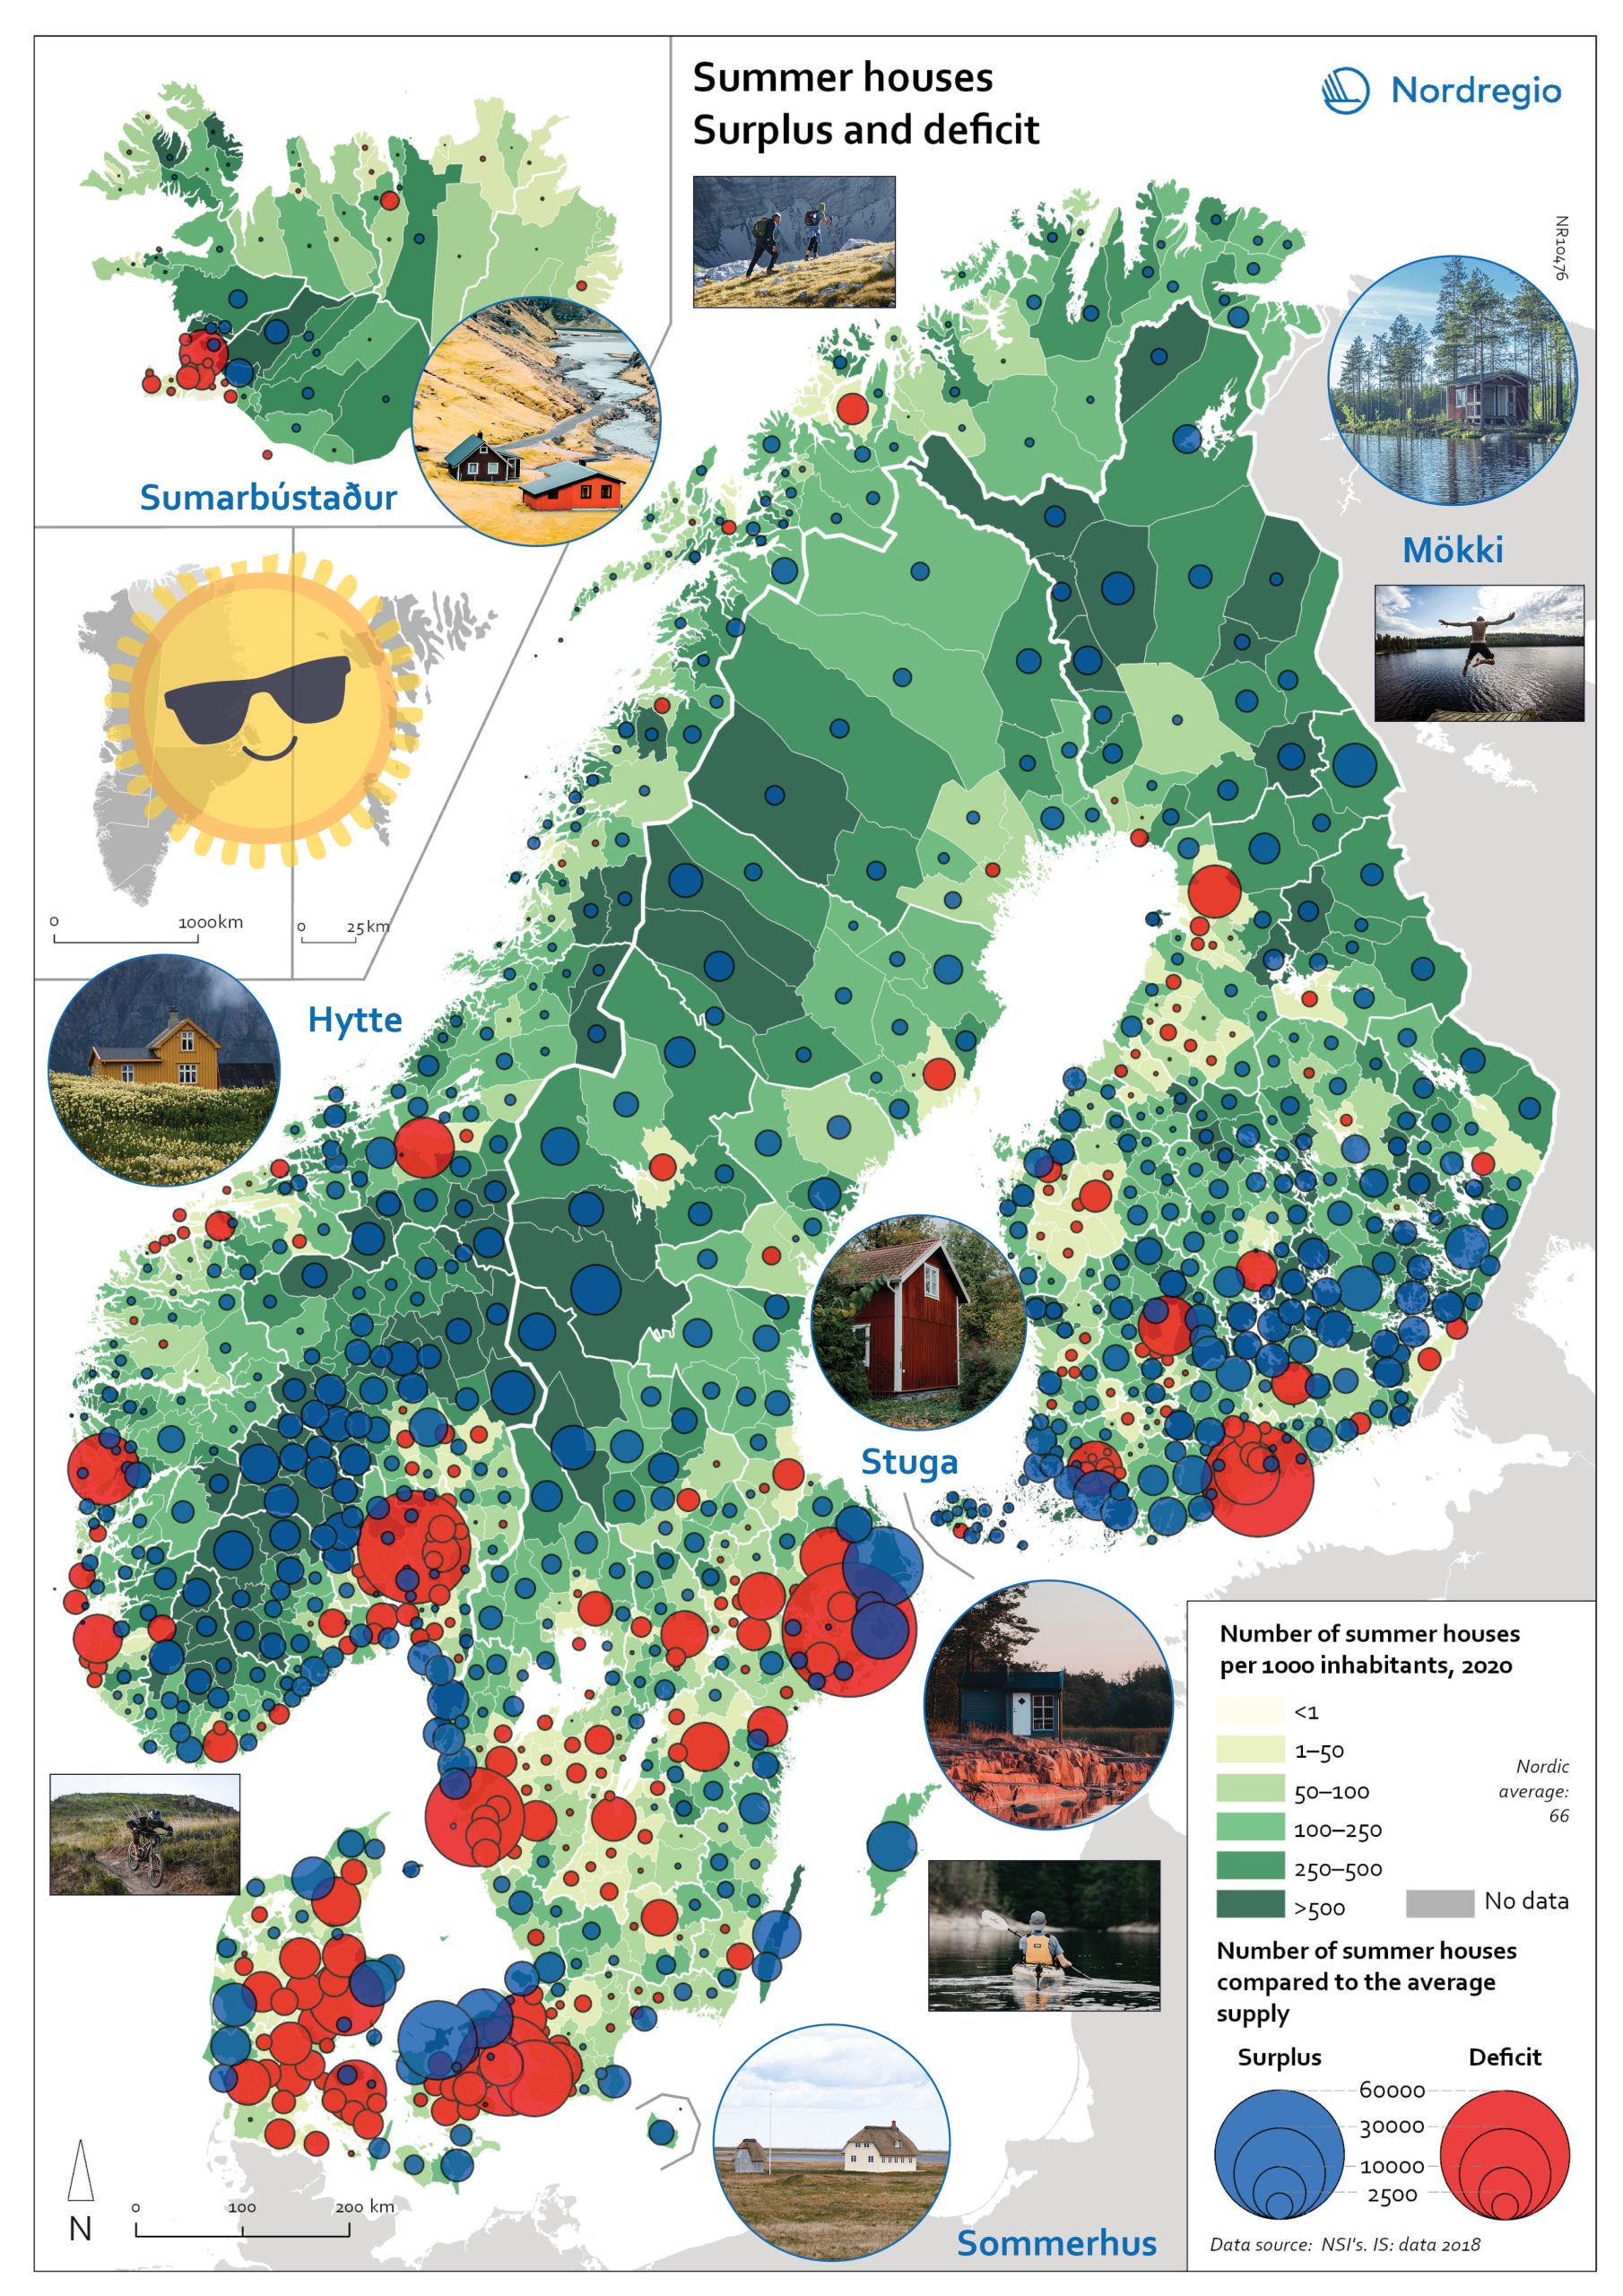
Nordregio Summer Map 2022: Empty streets, closed restaurants – where is everyone? Nordic cities are about to quiet down as millions of people are logging out from work. But where do they go – Mallorca? Some yes, but the Nordic people are known for their nature-loving and private spirit, and most like to unwind in isolation. So, they head to their private paradises – to one of the 1.8 million summer houses around the Nordics, or as they would call them: sommerhus, stuga, hytte, sumarbústaður or mökki. The Nordregio Summer Map 2022 reveals the secret spots. The Finnish and Norwegians are most likely already packing their cars and leaving the cities: the highest supply of summer houses per inhabitant is found in Finland (92 summer houses per 1000 inhabitants) closely followed by Norway (82). The Swedish (59) Danish (40) and Icelandic (40) people seem to have more varied summer activities. There are large regional differences in the number of summer houses and the number of potential users – so not enough cabins where people would want them! And this is the dilemma Nordregio Summer Map 2022 shows in detail. Most people live in the larger urban areas while many summer houses are located in more remote and sparsely populated areas. The largest deficit of summer houses is found in Stockholm: with almost 1 million inhabitants, there is a need for 65,000 summer houses but the municipality has only 2,000 to offer! So, people living in Stockholm need to go elsewhere to find a summer house. The same goes for the other capital municipalities which have large deficits in summer houses: Oslo is missing 44,000, Helsinki 43,000, and Copenhagen 34,000. Fortunately, there are places that would happily accommodate these second-home searchers. Good news for Stockholm after all as the top-scoring municipality…
2022 June
- Nordic Region
- Tourism

Change in overnight stays for domestic visitors 2019–2020
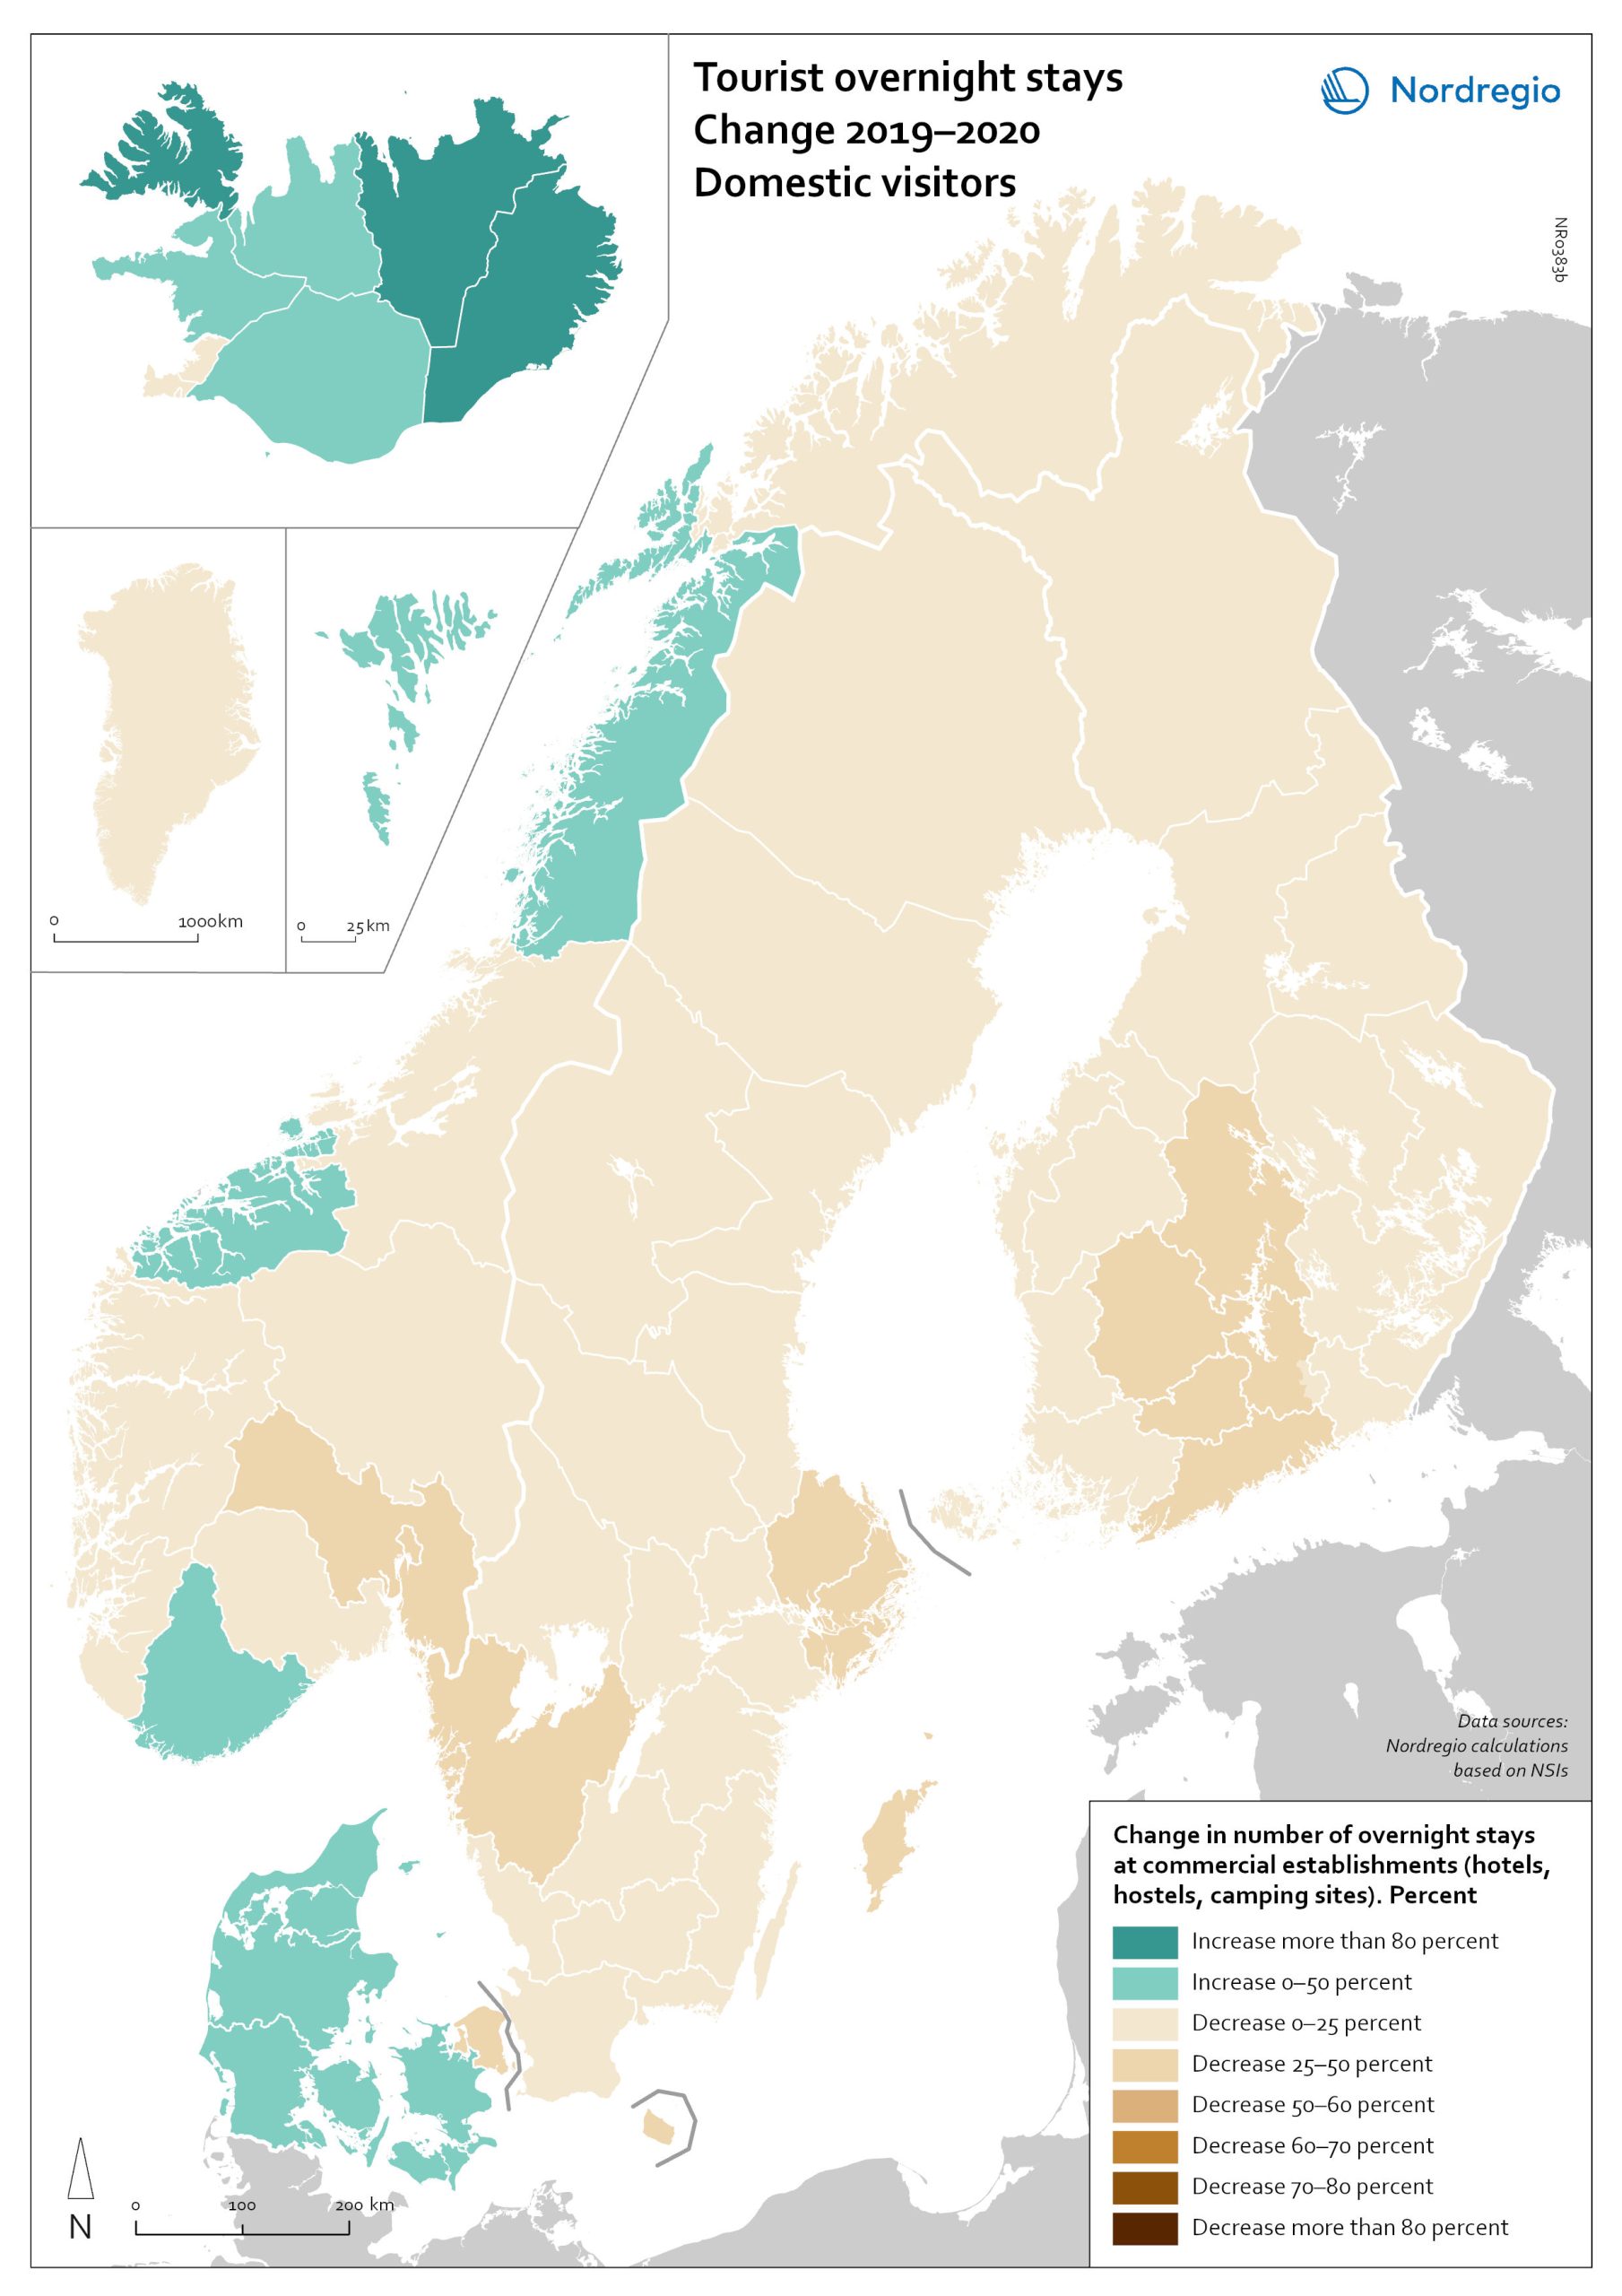
The map shows the relative change in the number of overnight stays at the regional level between 2019 and 2020 for domestic visitors. This map is related to the same map showing change in overnight stays for foreign visitors 2019–2020. The sharpest fall in visitors from abroad was in destinations where foreign tourists usually make up a high proportion of the total visitors. This is particularly relevant to islands like Åland (89% decrease on foreign visitors, from early 2019 to mid-2020) and to Iceland (66-77% drop depending on region). Lofoten and Nordland County in Norway, as well as Western Norway with Møre and Romsdal, which also have a high proportion of international tourists during the summer season due to their scenic landscape, also recorded sharp falls of 77-79% on foreign visitors during the same period. In Finland, the lake district (South Savo) and Southern Karelia, as well as the coastal Central Ostrobothnia (major cities Vasa and Karleby), recorded a 75-77% drop in the number of visitors from abroad. The fall here was mainly due to the lack of tourists from Russia. Even Finnish Lapland suffered a major fall in international visits during the winter peak period. For many local businesses that rely heavily on winter holidaymakers, the 2021/22 winter was a make-or-break season. In Sweden, the regions of Kalmar, Västra Götaland, Värmland and Örebro lost 77–79% of visitors from abroad, probably due to much fewer visitors from neighbouring Norway and from Denmark. In Denmark, the number of overnight stays by visitors from abroad to the Capital Region was down by 73%, whereas the number of domestic visitors declined by 27%. No region lost as many overnight visitors, both from abroad and domestic, as the capital cities and larger urban areas in the Nordic countries. Copenhagen, Oslo, Stockholm, Helsinki and Reykjavik…
2022 March
- Nordic Region
- Tourism

Change in overnight stays for foreign visitors 2019–2020
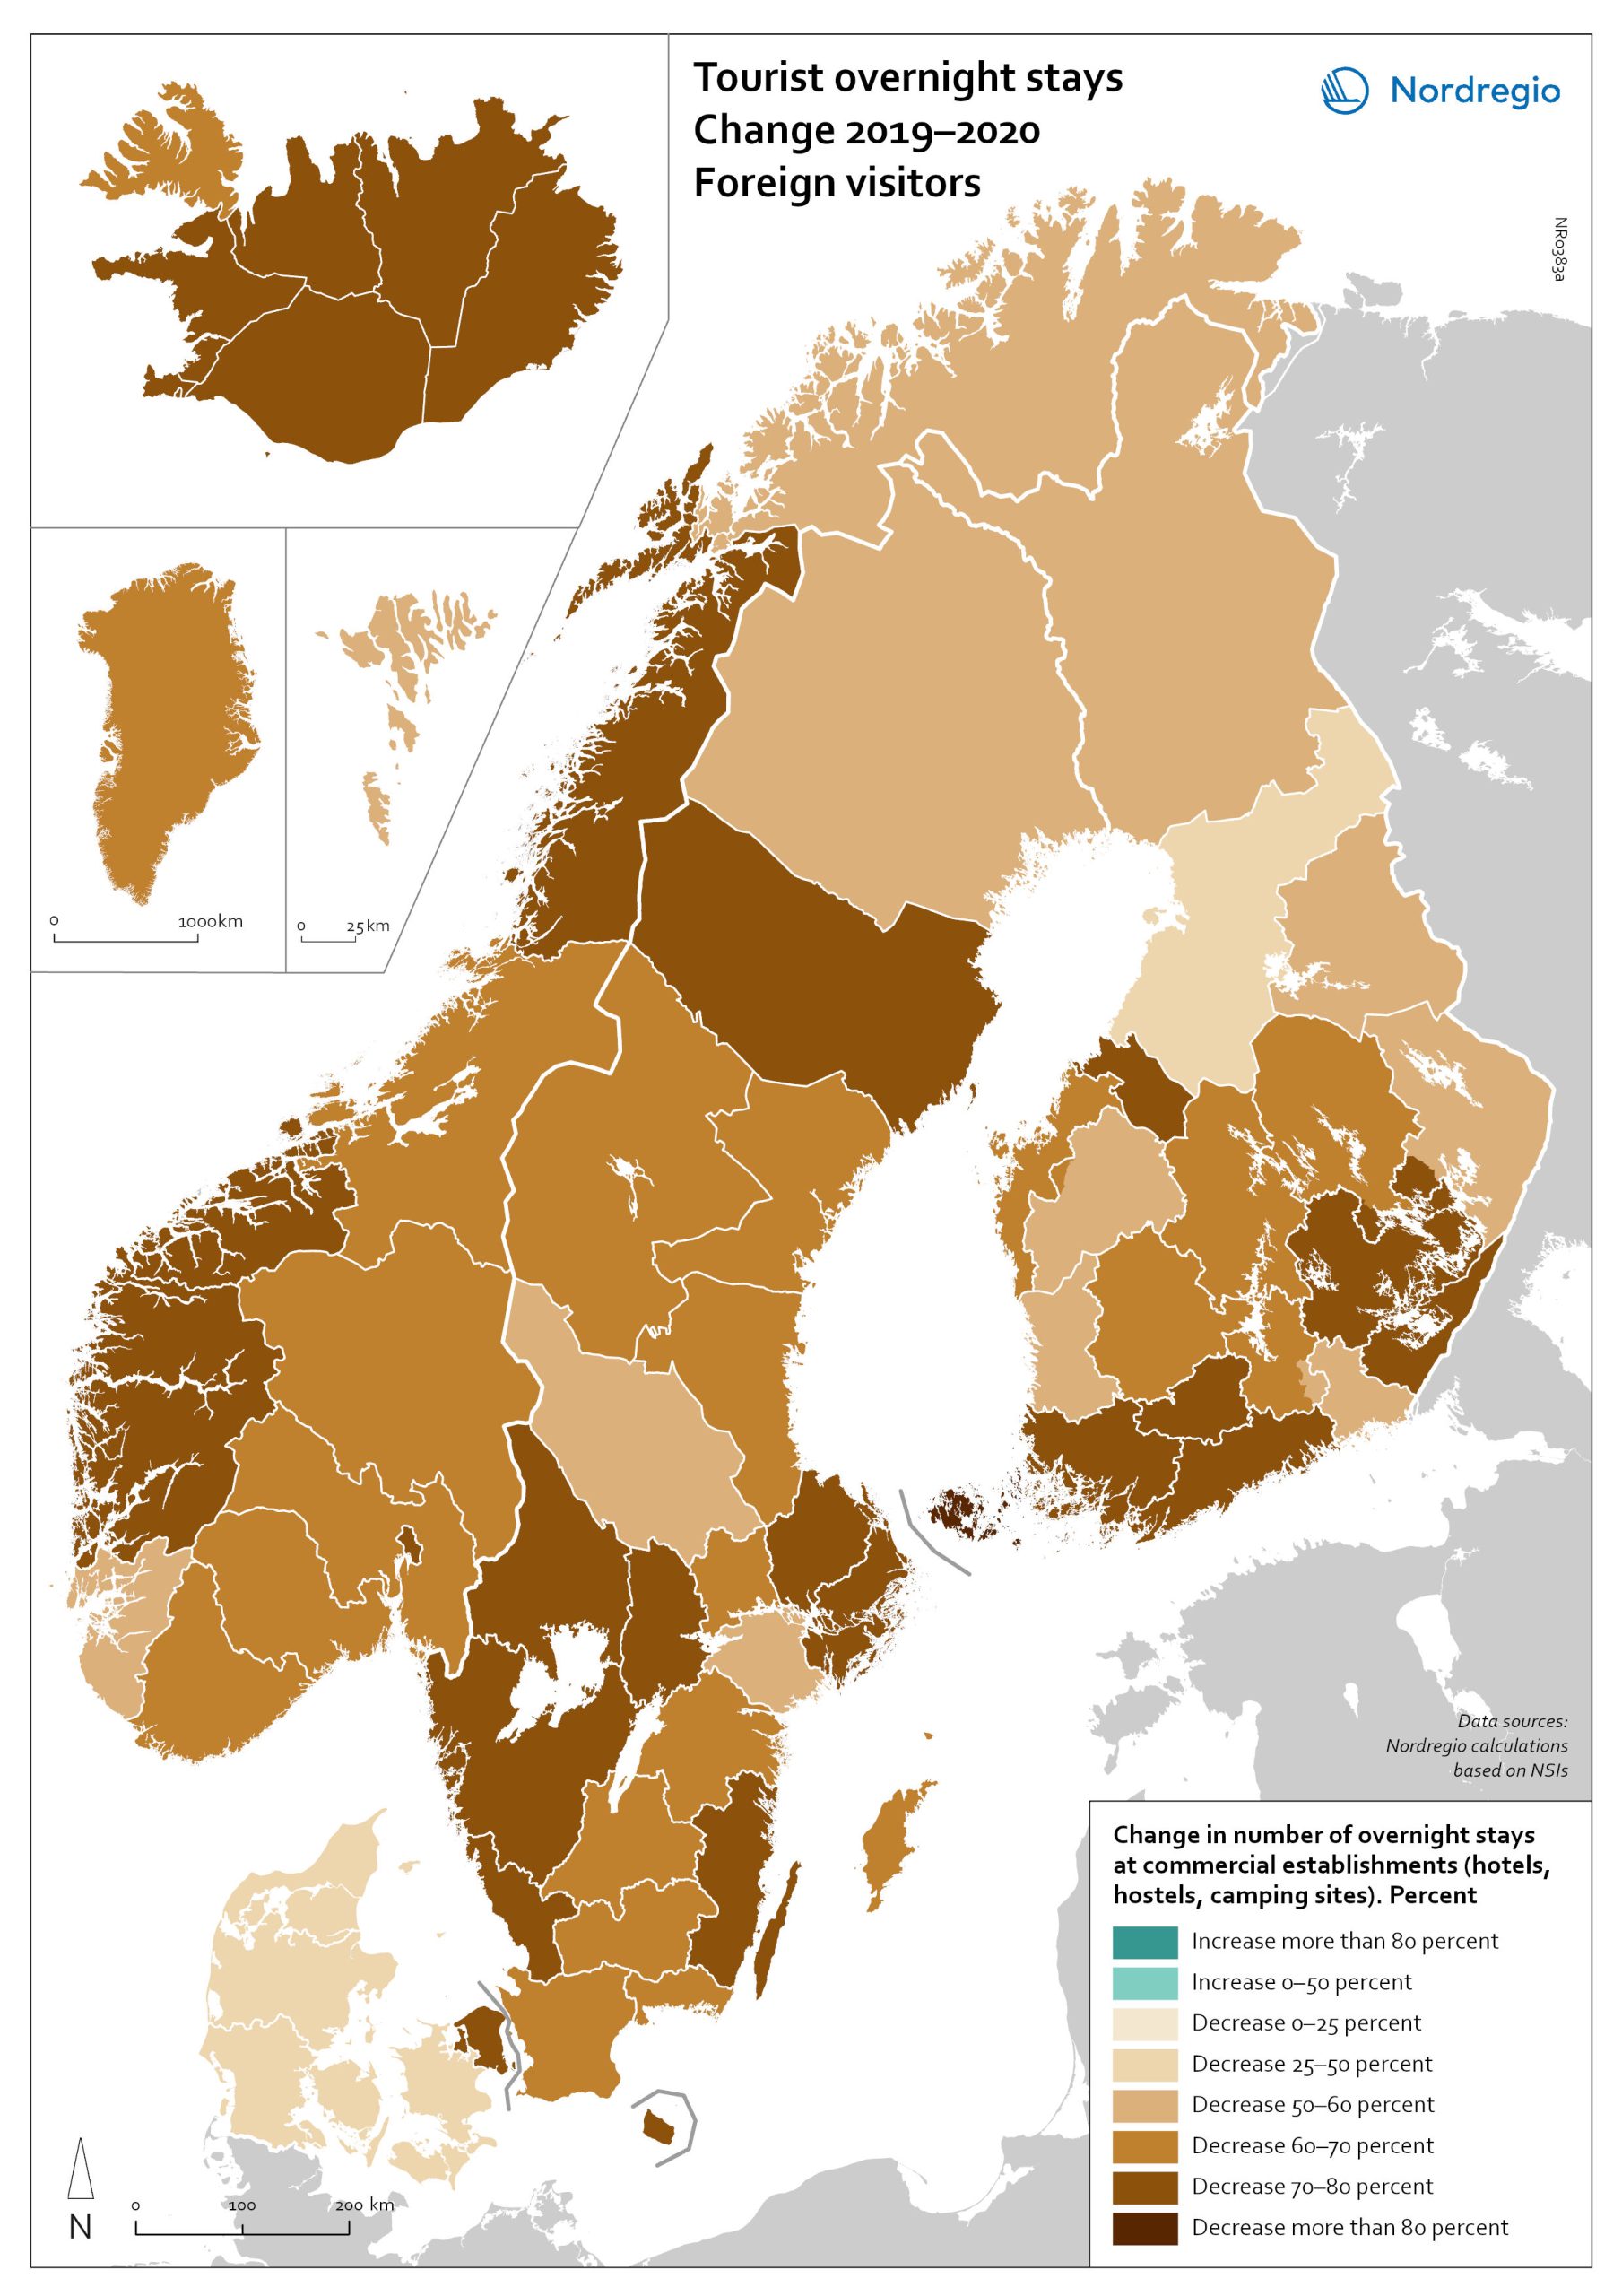
The map shows the relative change in the number of overnight stays at the regional level between 2019 and 2020 for foreign visitors. This map is related to the same map showing change in overnight stays for domestic visitors 2019–2020. The sharpest fall in visitors from abroad was in destinations where foreign tourists usually make up a high proportion of the total visitors. This is particularly relevant to islands like Åland (89% decrease on foreign visitors, from early 2019 to mid-2020) and to Iceland (66-77% drop depending on region). Lofoten and Nordland County in Norway, as well as Western Norway with Møre and Romsdal, which also have a high proportion of international tourists during the summer season due to their scenic landscape, also recorded sharp falls of 77-79% on foreign visitors during the same period. In Finland, the lake district (South Savo) and Southern Karelia, as well as the coastal Central Ostrobothnia (major cities Vasa and Karleby), recorded a 75-77% drop in the number of visitors from abroad. The fall here was mainly due to the lack of tourists from Russia. Even Finnish Lapland suffered a major fall in international visits during the winter peak period. For many local businesses that rely heavily on winter holidaymakers, the 2021/22 winter was a make-or-break season. In Sweden, the regions of Kalmar, Västra Götaland, Värmland and Örebro lost 77–79% of visitors from abroad, probably due to much fewer visitors from neighbouring Norway and from Denmark. In Denmark, the number of overnight stays by visitors from abroad to the Capital Region was down by 73%, whereas the number of domestic visitors declined by 27%. No region lost as many overnight visitors, both from abroad and domestic, as the capital cities and larger urban areas in the Nordic countries. Copenhagen, Oslo, Stockholm, Helsinki and Reykjavik…
2022 March
- Nordic Region
- Tourism

Sustainability classification of tourism development plans (TDPs)
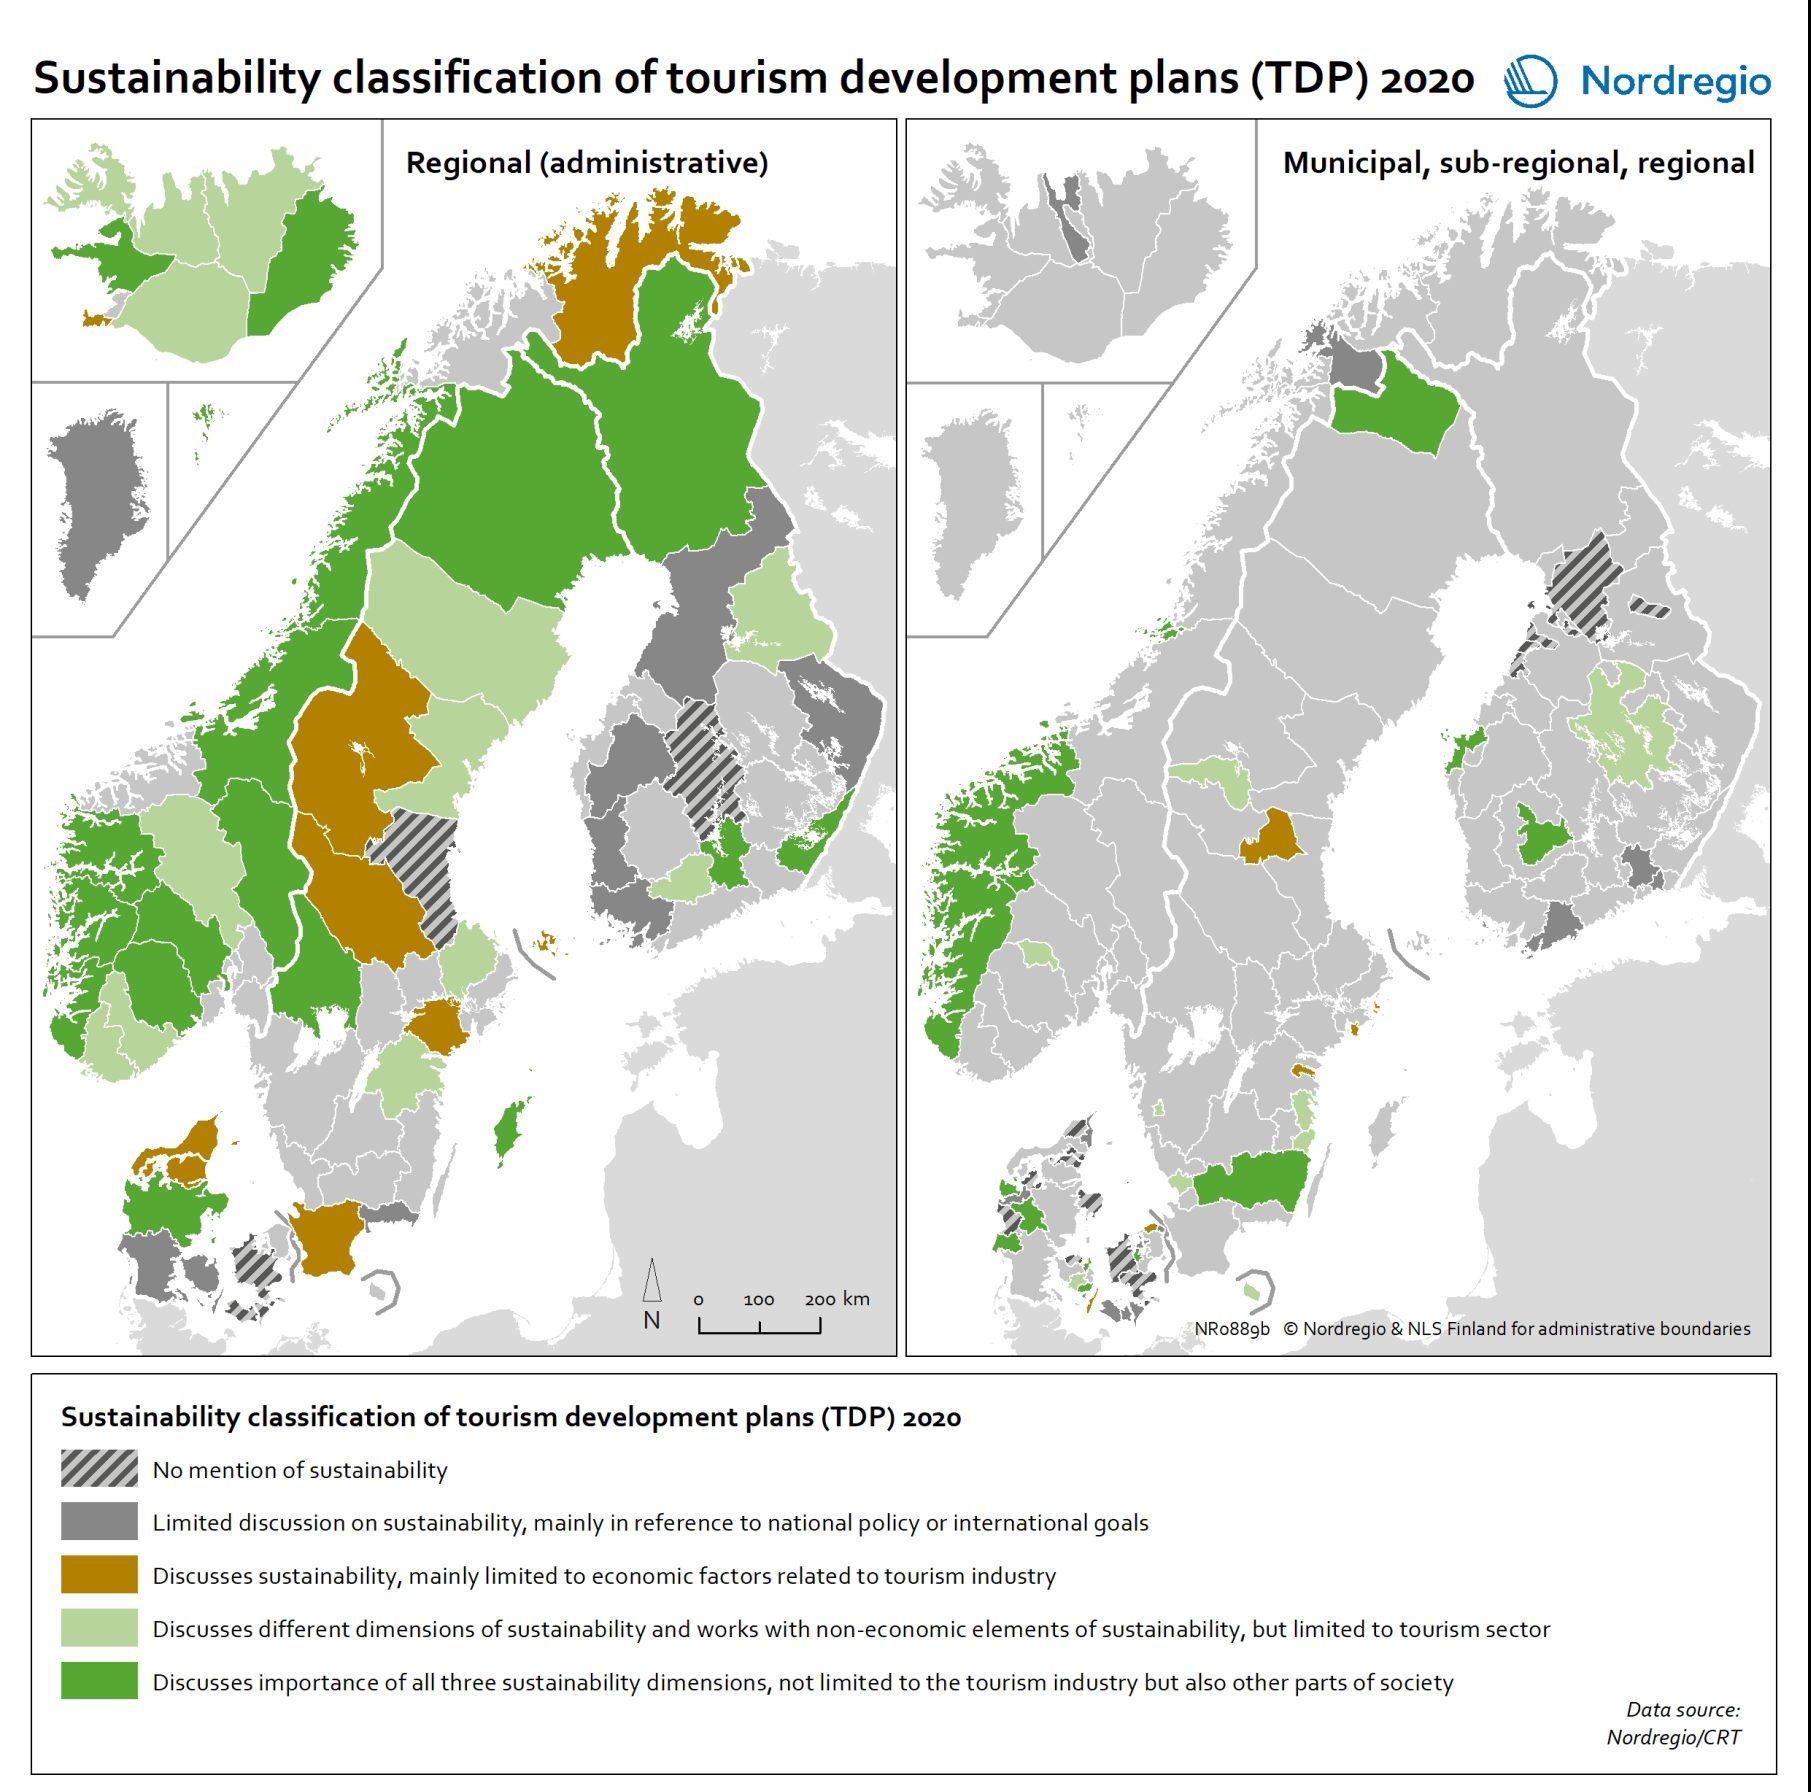
This map indicates the distribution of different TDP sustainability concern treatment classes in the Nordic Region in 2020 Sustainability is seen as an important part of the tourism development in large parts of the Nordic rural regions, at least on paper. Some tourism policies even state it as the point of departure, the light that guides the way in everything that tourism involves. A growing public awareness of the need to transition to more sustainable practices, increased public pressure, along with political statements and commitments to do so, means that we should expect to find sustainability concerns and the SDGs strongly reflected in sub-national plans for tourism development, too. In this map, the dotted areas represent those TDPs that do not mention sustainability in any way. These mainly come from Denmark, as well as a few from Finland, Norway, and Sweden. The grey areas represent TDPs who mention the concept of sustainability, but in a very limited way, as a reference to an overall, global or international or national agenda, but without further operationalising or setting any goals regarding this for the local context. This type of treatment of sustainability concerns is mainly present in Finland, followed by Denmark and Sweden, plus a few cases from Norway and Iceland. Together, these two types represent almost two out of every five TDPs. They greyish green areas represent those TDPs which limit their discussion of sustainability to the economic sustainability of tourism businesses. This type of TDP is mainly found in Sweden, followed by Denmark, and then a case from each from Finland, Norway and Iceland. The green areas, which represent just under half of the TDPs, engage in a holistic treatment of sustainability concerns, including their economic, social and environmental aspects. The light green TDPs, with a tourism-centred sustainability treatment, come…
2021 December
- Nordic Region
- Tourism

Saaʹmijânnam – Borders: 1949
The map shows the Skolt Sámi Land and the borders of national states in 1949. The Skolt Sámi Land is the home area for the indigenous Skolt Sámi people. During the Second World War, the Skolt Sámi land was the stage of violent acts of war. After the war, borders were again redrawn. The Soviet Union took the Petsamo area from Finland. The Skolt Sámi of Petsamo were given new settlement areas in north eastern Finland. In Norway and the Soviet Union, the Skolt Sámi remained an invisible minority. In all three countries, there was very little space for the Sámi. It took decades before the human rights of the Sámi received any attention. The map was produced for the exhibition Saaʹmijânnam – The Skolt Sámi Land in Äʹvv Skolt Sámi museum in Neiden, Norway. The map is the result of a collaboration between Äʹvv Skolt Sámi museum (responsible for the reconstruction of the Skolt Sámi areas and the exhibition), Yngvar Julin (concept of maps and exhibition architect), Nordregio (base maps) and Rethink. and illustrator Ruth Thomlevold (graphic design). Back to the main project page.
2018 January
- Administrative and functional divisions
- Arctic

Saaʹmijânnam – Borders: 1920
The map shows the Skolt Sámi Land and the borders of national states in 1920. The Skolt Sámi Land is the home area for the indigenous Skolt Sámi people. The borders through the Skolt Sámi Land were redrawn after the First World War. Newly independent Finland obtained the Petsamo area and thereby access to the Arctic Ocean. The Skolt Sámi living in that area became citizens of Finland instead of Russia. In Norway, the Skolt Sámi suffered from Norwegianization. On the Russian side, the Skolt Sámi were persecuted due to Stalin’s minority group policies. It became difficult to follow seasonal migration routes, a typical of the Skolt Sámi way of life. The Skolt Sámi of Suenjel area were the only ones able to carry out this traditional lifestyle. The map was produced for the exhibition Saaʹmijânnam – The Skolt Sámi Land in Äʹvv Skolt Sámi museum in Neiden, Norway. The map is the result of a collaboration between Äʹvv Skolt Sámi museum (responsible for the reconstruction of the Skolt Sámi areas and the exhibition), Yngvar Julin (concept of maps and exhibition architect), Nordregio (base maps) and Rethink. and illustrator Ruth Thomlevold (graphic design). Back to the main project page.
2018 January
- Administrative and functional divisions
- Arctic
- Migration

Saaʹmijânnam – Borders: 1826
The map shows how the borders of the national states in 1826 divided the Skolt Sámi Land. The Skolt Sámi Land is the home area for the indigenous Skolt Sámi people. Drawing the borders in 1826 has had a dramatic effect on the Skolt Sámi. Neiden and Pasvik areas were divided between Norway and Russia. The Skolt Sámi lost extensive parts of their living areas and their rights. They became citizens of two countries. Due to a growing number of immigrants, the competition for resources and land increased. The map was produced for the exhibition Saaʹmijânnam – The Skolt Sámi Land in Äʹvv Skolt Sámi museum in Neiden, Norway. The map is the result of a collaboration between Äʹvv Skolt Sámi museum (responsible for the reconstruction of the Skolt Sámi areas and the exhibition), Yngvar Julin (concept of maps and exhibition architect), Nordregio (base maps) and Rethink. and illustrator Ruth Thomlevold (graphic design). Back to the main project page.
2018 January
- Administrative and functional divisions
- Arctic

Saaʹmijânnam – the History: The monastery of Petsjenga and the fortress of Kola
The map shows the historical Skolt Sámi Land, the monastery of Petsjenga and the fortress of Kola. The Skolt Sámi Land is the home area for the indigenous Skolt Sámi people. The Russian tsar gave Skolt Sámi areas to the monastery of Petsjenga in 1556. The monastery operated a very successful business in reindeer herding, cooking salt and fishing. Petsjenga and Muetke sijdds were repressed under the monastery’s rule. The tsar had placed his officials at the fortress of Kola, in order to look after his interests in the northern areas. The map was produced for the exhibition Saaʹmijânnam – The Skolt Sámi Land in Äʹvv Skolt Sámi museum in Neiden, Norway. The map is the result of a collaboration between Äʹvv Skolt Sámi museum (responsible for the reconstruction of the Skolt Sámi areas and the exhibition), Yngvar Julin (concept of maps and exhibition architect), Nordregio (base maps) and Rethink. and illustrator Ruth Thomlevold (graphic design). Back to the main project page.
2018 January
- Administrative and functional divisions
- Arctic
- Others

Saaʹmijânnam – the History: Taxation and borders in 14th century
The map shows some of the borders in 14th century around the Skolt Sámi Land. The Skolt Sámi Land is the home area for the indigenous Skolt Sámi people. In 1326, the treaty of Novgorod led to the Sámi being taxed twofold. The Sámi areas were under pressure from both the east and the west. Karelian and Norwegian settlements spread to the north. Karelians collected taxes from the Sámi, as they themselves were obliged to pay taxes to Novgorod. The map was produced for the exhibition Saaʹmijânnam – The Skolt Sámi Land in Äʹvv Skolt Sámi museum in Neiden, Norway. The map is the result of a collaboration between Äʹvv Skolt Sámi museum (responsible for the reconstruction of the Skolt Sámi areas and the exhibition), Yngvar Julin (concept of maps and exhibition architect), Nordregio (base maps) and Rethink. and illustrator Ruth Thomlevold (graphic design). Back to the main project page.
2018 January
- Administrative and functional divisions
- Arctic

Saaʹmijânnam – the History: Assumed distribution of ethnic groups around year 500
The map shows the assumed distribution of ethnic groups in Northern Europe around year 500. The map was produced for the exhibition Saaʹmijânnam – The Skolt Sámi Land in Äʹvv Skolt Sámi museum in Neiden, Norway. The map is the result of a collaboration between Äʹvv Skolt Sámi museum (responsible for the reconstruction of the areas and the exhibition), Yngvar Julin (concept of maps and exhibition architect), Nordregio (base maps), Martin Skulstad, Rethink. and Ruth Thomlevold (graphic design) and Christian Carpelan (reconstruction of the areas). Back to the main project page.
2018 January
- Administrative and functional divisions
- Arctic

Saaʹmijânnam – the Community: Location of the Skolt Sámi sijdds with water bodies and elevation
The map shows the location of the seven Skolt Sámi sijjds. The word sijdd refers both to a geographic area and to the people who use it. The Skolt Sámi are an indigenous people with a unique culture and history. In the past, the Skolt Sámi knew exactly which areas belonged to their sijdd. If necessary, the borders of the sijdd could be redrawn by oral agreements. There were strong social ties between the Skolt Sámi areas. Marriages across sijdds were common. In some places, this sijdd system continued until World War II. In the past, the Skolt Sámi moved between several dwelling sites throughout the year. During winter, all the families of the sijdd moved to a common winter settlement. The Skolt Sámi lived on fishing, hunting and gathering. They also kept some reindeer and sheep. The resources of the sijdd were considered collective property, however movables and buildings were owned by individuals. This map shows the water bodies (lakes and rivers) according to their historical extent and location, before they were dammed up or given new courses during the 20th century. The map was produced for the exhibition Saaʹmijânnam – The Skolt Sámi Land in Äʹvv Skolt Sámi museum in Neiden, Norway. The map is the result of a collaboration between Äʹvv Skolt Sámi museum (responsible for the reconstruction of the Skolt Sámi areas and the exhibition), Yngvar Julin (concept of maps and exhibition architect), Nordregio (base maps) and Rethink. and illustrator Ruth Thomlevold (graphic design). Back to the main project page.
2018 January
- Administrative and functional divisions
- Arctic

Saaʹmijânnam – the Community: Location of the Skolt Sámi sijdds
The map shows the location of the seven Skolt Sámi sijjds. The word sijdd refers both to a geographic area and to the people who use it. The Skolt Sámi are an indigenous people with a unique culture and history. In the past, the Skolt Sámi knew exactly which areas belonged to their sijdd. If necessary, the borders of the sijdd could be redrawn by oral agreements. There were strong social ties between the Skolt Sámi areas. Marriages across sijdds were common. In some places, this sijdd system continued until World War II. The map was produced for the exhibition Saaʹmijânnam – The Skolt Sámi Land in Äʹvv Skolt Sámi museum in Neiden, Norway. The map is the result of a collaboration between Äʹvv Skolt Sámi museum (responsible for the reconstruction of the Skolt Sámi areas and the exhibition), Yngvar Julin (concept of maps and exhibition architect), Nordregio (base maps) and Rethink. and illustrator Ruth Thomlevold (graphic design). Back to the main project page.
2018 January
- Administrative and functional divisions
- Arctic

Saaʹmijânnam – the Community: Location of the Skolt Sámi Land
The map shows the location of the Skolt Sámi Land. The Skolt Sámi Land is the home area for the indigenous Skolt Sámi people. The Skolt Sámi are an indigenous people with a unique culture and history. Starting in 1826, various state borders were drawn through the Skolt Sámi homeland. Today, at least a thousand people can claim Skolt Sámi ancestry. Most of them are citizens of Norway, Finland and Russia. The Skolt Sámi Land is located in an area which today is divided between Norway, Finland and Russia. The map was produced for the exhibition Saaʹmijânnam – The Skolt Sámi Land in Äʹvv Skolt Sámi museum in Neiden, Norway. The map is the result of a collaboration between Äʹvv Skolt Sámi museum (responsible for the reconstruction of the Skolt Sámi areas and the exhibition), Yngvar Julin (concept of maps and exhibition architect), Nordregio (base maps) and Rethink. and illustrator Ruth Thomlevold (graphic design). Back to the main page.
2018 January
- Administrative and functional divisions
- Arctic

